You have been describing the noise in biology data (both convergence and divergence appear, for example) as a reason to reject the theory of evolution. So I think it’s worth having a discussion about signal and noise in the interpretation of scientific data.
Rather than just talk about our specific case, let’s bring in some other cases to help clarify how we ought to proceed. A clearly parallel case is at hand: the association of smoking and lung cancer.
As you know, the vast majority of the scientific community now accepts a causal relationship between smoking and lung cancer due to the results of a very large number of research studies. Yet I could very easily dismiss the consensus as bold overgeneralizations because I can cite a very large number of conflicting observations. Yes, I am referring to the millions of smokers who don’t get lung cancer, and the numerous non-smokers who do get lung cancer.
That’s a huge number of contrary observations to the prevailing consensus. Do you think, Cornelius, that a careful observer should reject the causal relationship between smoking and lung cancer due to the literally millions of observations that don’t agree with the purported relationship?
This post doesn’t show up in the Forum listing, but I finally found it.
You are using some loaded language there. Convergence and divergence is by no means “noise.” Furthermore, “reject” is a strong term. Evolutionary theory is problematic from a scientific perspective, yet evolutionists maintain it is a fact. Merely engaging the science and reckoning with the evidence would be a great step.
I am inclined to agree with you on the smoking/cancer link.
Outside the mainstream consensus, though, are plenty of voices that plead for the establishment to pull their blinders off long enough to engage with the contrary evidence. A certain Joe Vialls, for example, marshals a mountain of evidence against the smoking / cancer link:
Japan and Greece have the highest numbers of adult cigarette smokers in the world, but the lowest incidence of lung cancer. In direct contrast to this, America, Australia, Russia, and some South Pacific island groups have the lowest numbers of adult cigarette smokers in the world, but the highest incidence of lung cancer.
…
By the early 20th Century almost one in every two people smoked, but the incidence of lung cancer remained so low that it was almost immeasurable.
Vialls cites studies in rats and mice that show no link between smoking and cancer.
A mountain of evidence! Vialls says that you and I and mainstream science are so captive to our pre-conceived notions that we can’t see what really lies behind the 20th century explosion in lung cancer rates: nuclear weapon testing that released 4200 kg of plutonium and other radioactive by-products into the atmosphere (and hence, into our lungs).
Shouldn’t we drop our blinders, says Vialls, stop being in thrall to mainstream opinion, and take a new look at the evidence?
What do you think, Cornelius: is Vialls on to something, or is he just blowing smoke? Is there really a signal that indicates a causal relationship between smoking and lung cancer, or does Vialls’ citation of the contrary evidence give you reason to doubt the mainstream consensus?
Housekeeping note: This post was categorized under “blog post” (something I am going to edit in just a sec). If you click on the “open forum” link at the top of the page or from the BioLogos home page, you will only see topics that are categorized “open forum,” not the blog post related threads. If you click on the big “BioLogos Forum” at the top of the page, you will see all the threads, blog post related, open forum, and homeschool forum. You will also see all threads if you go to http://discourse.biologos.org
If the data presented here was the “smoking gun” that its author seems to hint it could be, don’t you think all the expensive pro-tobacco lawyers, lobbyists, statisticians, and scientists would have had a field day with this? It seems to have been come by rather easily (and without many controls for anything). Something stinks here, and I suspect if I were to look into it I would find numerous independent studies that very compellingly show the correlation so lacking in this particular gathering of data points.
If I’m wrong [and science is still lagging behind what my religion and common sense long ago told me about habits like these (with apologies to Lewis, Chesterton, and many others — but… not really) ] then this would make an interesting parallel study on behalf of what conspiracy theorists are always trying to bake up. But if my suspicions would instead prove correct, then its a good case study of doubt-mongerers trying to cast their nefarious shadows on established science. Either way, the study would be interesting, no?
Not long ago, they did have a field day with studies like these. A lot of chimps got addicted to tobacco in industry-sponsored research.
You are essentially making an appeal to authority, and in this case it is very well justified, I think. The key point you are making is that there is a social dynamic in play, and the doubt-mongerers are engaged in motivated reasoning. Much of the scientific consensus is also engaged in motivated reasoning, as well. Fortunately, we don’t have to just throw up our hands and say it’s all post-modern, we can’t make progress on an issue. If the scientific consensus is truly well-supported, the case for it will be much stronger than the doubt-mongerers’ case, and as a community we will have good reason to say: “science says this.”
I will give my analysis later, but first I want to give our friend @Cornelius_Hunter a chance to provide more than a one word answer.
I have changed the alternative interpretations of consistency index data to be evolution (E) and not-evolution (E’) so as not to imply that Hunter advocates randomness rather than design. E’ could be either design or randomness or anything other than evolution, really. Also, since (without quantitative modeling) Hunter thinks evolution should predict a consistency index of 0.8, I have edited one diagram accordingly. Finally, I have added an explanation of why the consistency index is a good way to detect nested hierarchy in a common descent model. All changes are in bold.
I would like to ask a favor of everyone in this thread: could we try to maintain our focus on how to identify signal and noise, and how it affects inference from data to scientific theory? The argument over definitions is interesting–so interesting, in fact, that it perhaps deserves its own thread.
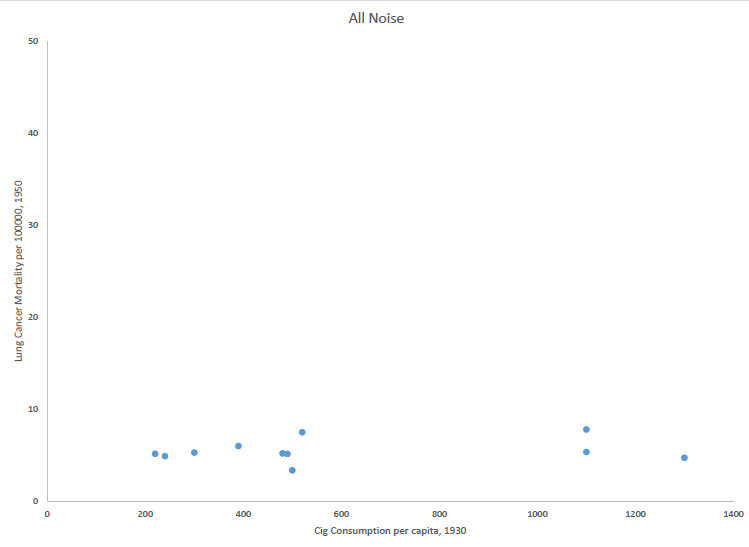
The main reason it took so long to convince the public of the causal relationship between smoking and lung cancer–other than the fact that millions of people enjoyed smoking those things–is that the data have plenty of noise. In the early 1950s Doll released the first ecological study of smoking and lung cancer. If the relationship were all signal and no noise, his data would have looked something like this:
Clearly the data show a strong positive correlation between smoking and lung cancer (diagnosed 20 years later). The p-value of this correlation lies far beyond the .05 statistical significance boundary. At the same time, there is plenty of noise: compare USA in the lower right corner with Switzerland middle left, for example.
The critics of the scientific consensus cite the noise in the data as a reason to reject the consensus. For example, Vialls cites the outliers in a different study as proof that that the consensus is wrong. But the consensus does not predict 100% signal in the data. Scientists expect noise because lung cancer has many factors: time duration of smoking, multiple environmental factors, and some (perhaps many) genetic factors. Since these factors vary independently of smoking habits, they introduce noise in the data. We also expect a significant time lag (decades) between inception of smoking and cancer diagnosis, and this lag can also differ between observations. (It would also explain why rats and mice don’t get lung cancer–have you ever met a 25 year old rat?) The key point is that the (implicitly causal) time-lagged relationship is extremely significant statistically, across many data sets besides Doll’s.
Bottom line: in the real world, there are real explanations for noise in the data on smoking and lung cancer. The noise therefore does not, by any stretch of the imagination, refute the strong, statistically significant evidence for a causal relationship between smoking and lung cancer.
Now let’s turn to our favorite scientific subject: the theory of evolution. Like the scientific consensus about smoking and lung cancer, the scientific consensus about evolution rests on a large, diverse set of data. But critics of this consensus, like @Cornelius_Hunter, do not hesitate to cite noisy data as reason to reject the theory. Let’s take a look at a notable example our friend Cornelius recently cited in another thread: Klassen’s 1991 article on the consistency index.
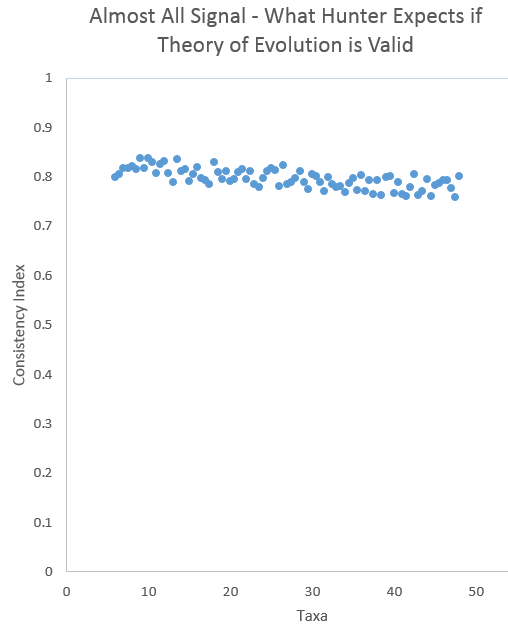
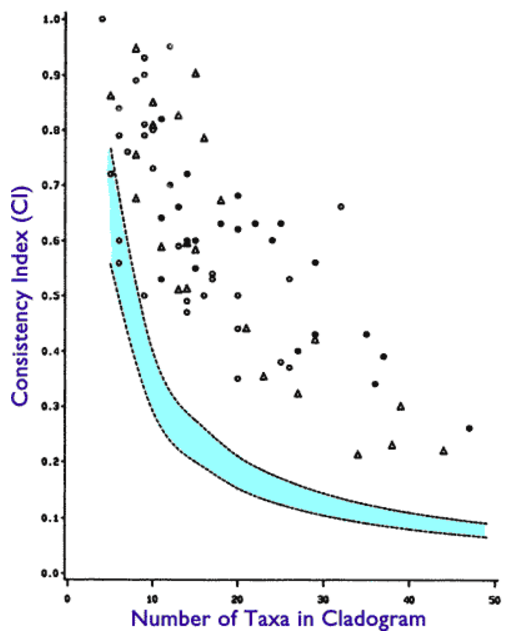
A consistency index measures the extent to which a set of taxa can be arranged in a hierarchical phylogeny based on measurements of some characters. Mathematically, it represents the minimum number of possible changes divided by the actual number of changes needed to represent the most parsimonious nested hierarchy. A consistency index of 1.0 means that there is a perfectly consistent hierarchical phylogeny in a set of taxa (species) based on measurements of certain characters. The theory of evolution predicts statistically significant consistency indices that indicate phylogenetic relationships. If evolution were true, Hunter claims, the CIs would be very close to 1.0–something like this:
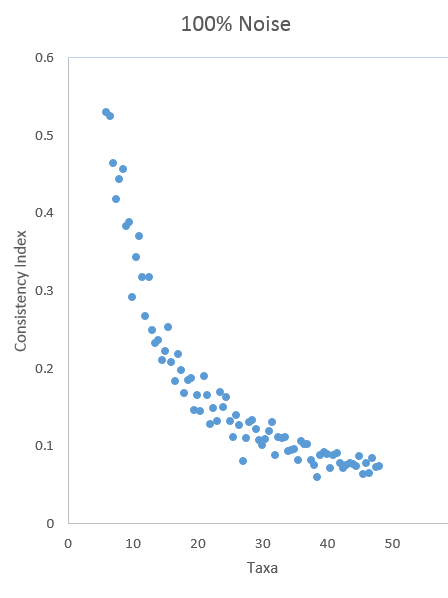
By contrast, if there were no signal of phylogenetic hierarchies, any scientist would expect 95% of the data sets to lie inside the statistical significance boundaries for a randomly constructed data set–i.e. within 2 standard deviations of the best fit curve of consistency indexes for those random data sets. Due to my inferior graphing skills, I am only providing a scatter plot without the significance boundaries:
However, as with smoking and lung cancer, the actual consistency index data show both a very strong signal of hierarchical phylogeny and abundant noise:
The blue region delineates where the null hypothesis is more than 5% probable.
Is it appropriate to expect significant noise in the data? Absolutely! As Matzke states:
creationists make the perfect the enemy of the good. They completely fail understand the difference between “classic homologies” – like the tetrapod limb – and the typical characters used in modern “get as many characters as you can” analyses. In the latter, organisms are atomized as finely as possible while avoiding coding the same character twice under two descriptions. Yes, it would be highly problematic to suggest that the tetrapod limb evolved twice independently. But if you take that limb, and atomize into 100+ individual characters, including the bumps and twists of each bone – is it possible that some of those bumps arose twice independently? Heck yes! If they arose once, they could arise several times, because these highly atomized characters are quite simple (unlike the whole tetrapod limb). Does this homoplasy invalidate the entire enterprise of cladistics and verifying common ancestry? Heck no! Some of those characters might have homoplasy, some might have such high homoplasy that they retain no phylogenetic signal at all (a different thing) – but if you have lots of characters, it doesn’t matter. All that is required is that, on average, most characters retain some phylogenetic signal.
Finally, it is important to address Hunter’s dramatic misunderstanding of how to determine whether a phylogenetic relationship is signaled or not. Let me put some numbers in front of you, dear reader, to explain. When there are 40 taxa, a completely random CI is 0.10, and of course the CI of a perfectly nested hierarchy would be 1.0. Hunter is claiming that if the measured CI is arithmetically closer to 0.10 than to 1.0, the hypothesis of not-evolution (call it E’) is victorious, and a hierarchical phylogeny (call it E) is disproved. I.e., according to Hunter, the value of the CI must be greater than 0.55 to signal a hierarchical phylogeny for 40 taxa. If the value is 0.54 or below, the E’ hypothesis is considered proven.
This is so wrong.
Any observation that is greater than the blue region demonstrates a hierarchical phylogeny at a statistical significance level of 95%.
The line that bisects the blue region is the mean CI for taxa with randomly assigned characters. The distance between this mean and the outer boundary of the blue region is 2.0 standard deviations (by the definition of statistical significance). Just casually observing the chart, you will notice that the vast majority of the CIs are at least 10.0 standard deviations from the mean random CI. This means that probability of the E’ hypothesis for any one of those CIs is only 0.0025.
Given that Klassen listed about 80 CIs that reached at least that level of statistical significance (and many had far greater statistical significance), the probability that the entire set of CIs can be attributed to the E’ hypothesis is 0.0025^80, or about 1 in 10^178. This is back of the envelope, of course, but it indicates just how wrong @Cornelius_Hunter’s analysis is.
Bottom line: in the real world, there are real explanations for noise in the consistency index data. The noise therefore does not, by any stretch of the imagination, refute the overwhelming, statistically significant evidence for hierarchical phylogenies among species.
But occasionally slipping up and doing the math wrong is not a sin. I hope no one who reads this thinks I am criticizing Cornelius personally. I am just criticizing the way he does math when he analyzes the consistency index data.
Sorry for the long post, but I couldn’t think of a clear way to explain this in fewer words and pictures. All the diagrams that are not attributed to specific publications were drawn in Excel 2016 by yours truly. If you got to this point, thanks for sticking with me, and I hope you learned something useful.
Could you clarify the situation, then, in your own words? I’ve seen you offer the Klassen paper as evidence against common descent, but on the face of it, it offers strong evidence for common descent.
Well my point was straightforward. I made the observation that the CI values often are actually closer to the random model than to 1.0 (the ideal common descent model), and that this better fits the design model than the common descent model. As I explained, design trends emerge simply due to the constraints of natural laws, the same planet, biosphere, etc. Or as Fernald put it:
Although the variety of eyes in the animal kingdom seems astonishing, physical laws have constrained solutions for collecting and focusing light to just eight types of eye optics.
You said that the consistency index data “on the face of it, it offers strong evidence for common descent.” Actually, if anything, on the face of it the data are evidence for design.
Of course, we all understand common descent can explain the evidence. But that is because common descent can explain practically any evidence. If CI ~= 1.0, common descent could explain that. Common descent can explain a wide range of outcomes, but that is not a virtue when it comes to theory evaluation.
How could you see this as strong evidence for common descent? What this points out is how far data can be from the model and (i) not only do no harm, but (ii) actually be greeted as “strong” evidence. This is not a virtue.
For instance, let’s consider this in Bayesian terms, in order to see what evolutionists are claiming here. In order for these observed CI values to be “strong” evidence, the probability of observation (low CI values) given the hypothesis of common descent, P(O|H), would need to be very high. In other words, on common descent, the CI value is very strongly expected to be down there closer to random than to 1.0. This means that for larger CI values, as it gets closer to 1.0, P(O|H) necessarily decreases significantly, and becomes pretty small.
But this clearly is not the case. On common descent, this simply does not happen. High CI values would do no harm, and in fact would be closer to the ideal common descent model. Evolutionists would of course have no problem with such findings, and certainly would interpret it more positively. P(O|H) would increase, not decrease.
The fact is, this is not good evidence for common descent, and is a better fit for design, as I have explained. So here is a notional illustration of this. For a given #taxa, you have a “random” CI band, and the observed CI values above that, and then way up higher the ideal common descent model. Evolutionists have for years complained “why would God make it appear to have evolved?!” Well here is the answer: it doesn’t. Clearly the CI values, by the evolutionist’s own reckoning, are a better fit to design than to common descent.
Clearly the CI values are not “strong” evidence for common descent. You can always claim that common descent is capable of explaining the evidence, but that is a very different claim. Chris lectures me on evidence interpretation, but perhaps you guys need to think a bit harder about this. Agreement is probably too much to expect, but at least to acknowledge, “OK, this is their position—this is why they say what they say, and this is the strength of their argument”, rather than straw-manning it.
When I criticize evolution, I first want to understand it in all its strength. I want to understand why evolutionists say what they say. And who knows, perhaps that exercise will change my mind. But it will do no good if I’m merely knocking down strawmen. I’m gratified when evolutionists say “I disagree with your conclusion, but I appreciate that you have represented my position in its strength.”
Instead Chris has taken the low road. He has gone the extra mile, putting words in my mouth to make it appear I am making basic, high school math mistakes and rendering my argument as absurd. I shudder to think what is said about me when I am not here to read the posts.
I like this post, especially your graph. It is very elucidating.
Can you explain how you derive it? I have several key questions about it:
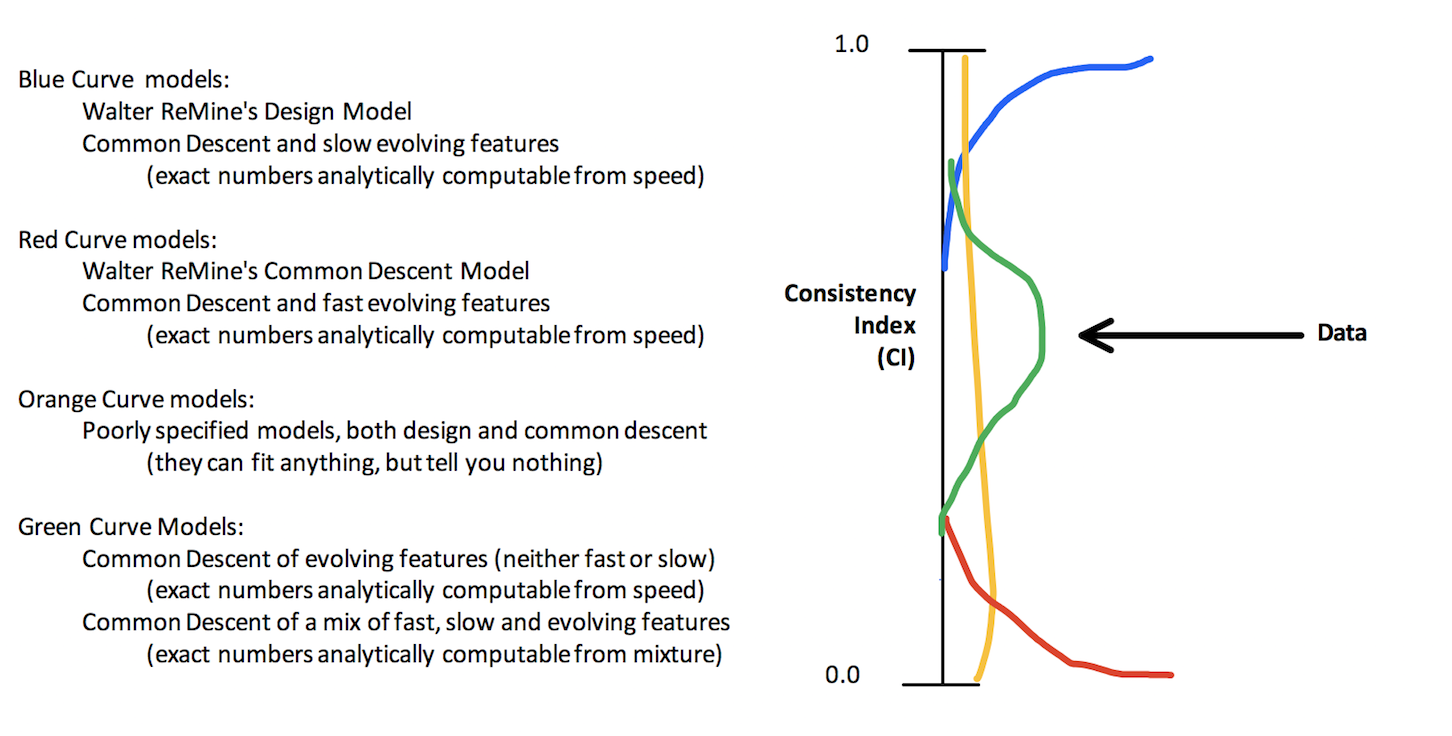
How did you arrive at the conclusion that Design should have less consistency (at about 0.6) than common descent (at about 0.8)? Walter ReMine (a YEC that rejects evolution) argues exactly the opposite, that design should produces more consistency than common descent (he argues it should be close to 1). Which of you is right? And how do we know?
If possible (though I understand this is not likely), can you please show your math. How did you arrive at such precise numbers, with non-overlapping uncertainty?
You also point out that you are using an “idealized” common descent model (which presumably does not model any noise). So why should we trust it? Don’t we want a realistic common descent model that includes noise, and would therefore reduce the expected CI?
Why are you blaming me for interpreting your words in the way that mathematically literate English speakers would normally understand them? You seem to be implying that I am remiss for not being able to read your mind and understand that the words you wrote were not to be interpreted according to standard English usage.
Wouldn’t it be better to say, “I realize now that what I wrote was unclear. Let me speak more clearly now”? That is almost verbatim what I said in a different thread last week.
Because the data is highly inconsistent with the null hypothesis, and the null hypothesis seems to be the only available model with which we can compare the actual distribution.[quote=“Cornelius_Hunter, post:14, topic:35048”]
What this points out is how far data can be from the model and (i) not only do no harm, but (ii) actually be greeted as “strong” evidence. This is not a virtue.
[/quote]
It’s neither a virtue nor a vice. It’s just a fact that noisy data can provide strong support for a hypothesis.[quote=“Cornelius_Hunter, post:14, topic:35048”]
For instance, let’s consider this in Bayesian terms, in order to see what evolutionists are claiming here. In order for these observed CI values to be “strong” evidence, the probability of observation (low CI values) given the hypothesis of common descent, P(O|H), would need to be very high.
[/quote]
Not at all. The Bayes factor is the ratio of the likelihoods(*) of the data for two models. The likelihood of the data given common descent is small, but much larger than the likelihood of the data given the null hypothesis. (Note that in Bayesian or maximum likelihood model testing, the absolute likelihoods can be very small indeed, a fact that is irrelevant to choosing the better model.) That’s why I told you before that you had to offer an alternative model that did a better job of explaining the data.
(*) More properly, the likelihood of the data integrated over model parameters.
As @Swamidass pointed out, you haven’t justified your distribution under the design model at all.
First rule of responding to paper reviewers: if the reviewer completely misread your crystal clear prose in the most idiotic way possible, it’s still your fault. If you’re unable to communicate successfully with a reviewer, then you’re failing in your job as paper-writer.
A key variable you are missing is the “speed” at which a features evolves (which is often directly measurable). Depending on this parameter, common descent will make different predictions. This isn’t cheating, because we can directly measure the speed in many cases (especially with DNA), and this gives us a way of analytically computing the expectation.
Any how, I think (in my opinion), ReMine’s model corresponds to the blue line, the features used in this analysis correspond to a mixture of slow and fast evolving features, so in this case CD corresponds to the green line. And your model corresponds to the orange line, because it is not specified at all.
So the data ends up fitting CD the best. I should point out that I believe in design too; design by common descent. So in no way does this rule out that God created us. Rather, it tells us that common descent is the best design principle to understand biology.
Well you are going from bad to worse here Steve. The null hypothesis is generated using a random number generator to scramble the data randomly. In other words, the null hypothesis is physically meaningless. It completely disregards the science. There is zero science accounted for. It tosses out the biology, physics, ecology, etc. What you are claiming here is that either the world is utterly chaotic and random, or else common descent is true. Any species can take on any character trait, at anytime, anywhere. There is no context. This is fact-free science. And this is how you judge these data to be “strong evidence for common descent.” Either a physically meaningless reality obtains, or else common descent it true. This is utterly pathetic and ridiculous. And you guys lecture me on philosophy?
Your reasoning is circular. You characterize the data as “noisy” because it does not fit your model. Your interpretation is “theory-laden.”
Yes.
This is truly astonishing. Not only did I justify it, but that justification, as I indicated, runs all through the evolution literature! To say that I haven’t justified my notional design distribution model at all is not only false, but an incredible example of having it both ways. This is what evolutionists have been insisting all along!! It goes all the way back to Darwin. I mean, you gotta love evolution. Just so readers can fully appreciate the humor here, I’ll paste in what I said:
So I haven’t justified the design model at all?
What is so ironic here is that evolutionists have been pounding this message home all the way back to Darwin: “Design and creationism aren’t constrained to the common descent pattern, but we are!!” they have repeatedly proclaimed. And now, suddenly it’s “what ever could you be talking about? What a strange notion this is.”
Sigh. This is why these discussions become so tedious. So, here we go:
And Chris’s incredible strawman:
As is obvious, that is a misrepresentation of my point. And here is Steve’s response:
Sigh.
As for Remine, his model is not mainstream or consensus. That is not to dismiss it, it is just a statement of fact. One can find all kind of outlier ideas in evolutionary thought as well, but I would never use them in a rebuttal or criticism of evolution. There’s no question, for objective observers, that the consensus views are that the common descent model calls for a higher CI than the design model.