Nested Clades, The Consistency Index, and Affirming the Consequent

Well, I’ve laid out in great detail how it all fits together. And what I need to show is not very complicated. To disprove the nested clade argument all I have to do is show that a dataset generated by a DAG also exhibits high CI. I’ve provided pretty graphs that demonstrate this is the case. I’ve provided a straightforward logical contradiction to the following:

phylogenies based upon true genealogical processes give high values of hierarchical structure, whereas subjective phylogenies that have only apparent hierarchical structure (like a phylogeny of cars, for example) give low values

I’ve done it at the gene level, and then reduced it to the nucleotide level and did the same.

I cannot think of anything I did incorrectly in all of this. If you have specific things you think I may have made a mistake in, please let me know, and I will do my best to correct it. I believe all my work is fairly easy to grasp with a bit of inspection, and I’m always willing to explain anything that doesn’t make sense.

The nested clades argument is primarily based on high phylogenetic signal in genetic datasets. I’ve shown genetic datasets can produce high phylogenetic signal, and have nothing whatsoever to do with common descent or evolution. As such, the nested clade argument must be said to be invalid at this point in time.

But, I understand that it is hard to accept something that flies against what the experts say. I currently have a post awaiting moderation over at theskepticalzone.com, where John Harshman, Joseph Felsenstein, and a variety of other evolutionary scientists hang out. We will see what they say.

I am sincerely trying to find some strong evidence of evolution which I can test myself. So far everything I’ve found falls apart when I dig into it. Probably you all suspect my motives or something, otherwise I’d think these holes I’m finding would attract more interest, or perhaps spur you to try and dig into the evidence more for yourself.

I don’t think that Talk.Origins has good updating. The consistency index has been largely abandoned because it is not very informative (actual evolutionary data sets give generally fairly similar results) and is influenced by multiple factors (such as how many taxa are involved). Although nested clades are a good measure of evolutionary consistency, CI is not that great of a measure of nested clades. But also, your examples of random data having high CI values are not addressing the question of nested clades and CI. Rather, what you need to look for is whether different trees generated for the same data show noticeable differences in the CI. If so, do the trees with high CI values show similar clades? Especially if you look at different data sets for the same taxa and consistently get higher CI for trees including certain clades and not others, that would suggest that certain clades are distinctly better supported and other groups are not. An evolutionary pattern would be expected to generate a reasonably consistent pattern of clades (though it would also be expected to produce some convergence, incomplete lineage sorting, etc.) Under non-evolutionary scenarios, there’s no reason for organisms that are similar in one way to be similar in other ways that do not link to the first. If the data in question do not reflect any evolutionary pattern, then different patterns with non-matching clades are likely to have near-equal support. The CI distribution for random data would be expected to be closer to a bell curve; the CI distribution for evolutionary data is expected to be more asymmetric across numerous tree configurations. As an added complication, how things like CI are calculated for a star-type tree varies. It’s true but trivial to say that a star tree does not generate any contradictions because it also does not give any information. If and how that insight is implemented in a particular evaluation program will vary considerably.

3 Likes

Thanks for this primer on the uses and misuses of Consistency Index analyses, David! The 2 key points I am deriving from your post are:

  1. Biologists do not simply select the highest CI tree in a cladistic analysis and call it a day (which is, AFAICT, the approach @EricMH seems to have taken). Instead, they measure the stability of the clades in the vicinity of the CI peak, and only trust the outcome if that stability is found.
  2. As the field has advanced, biologists are no longer relying on low-taxa CI analyses.

Have I grasped your key points correctly?

Noob questions:

  1. What statistical metric would you use to measure the stability of cladograms in the vicinity of the CI peak?
  2. You mentioned that “CI is not that great of a measure of nested clades.” What would be a better measure?

Also, if you could introduce a little more about yourself, I’d be grateful.

Peace,
Chris

2 Likes

It’s always tough when some random guy on the internet comes in guns ablazing falsifying common ancestry.

It is curious how you have that special power when it comes to certain topics.

Well you probably do reject common ancestry because of very strong religious beliefs. Probably to the point where I would say your prior belief might override your ability to evaluate any evidence. E.g.

P(A|B) = 1 when the prior probability of A is 100% given any further evidence you could ever look at.

My personal opinion is that a more useful approach is not for you to try and falsify common ancestry, but to make specific predictions of what we should find given your model. What is your model? What sorts of predictions does it make of what we should find in nature? How well does it describe the evidence? Because a big mistake a lot of people make is “if I can just prove evolution wrong or silly, then logic dictates what I believe about the origin of species must be right!” Sometimes Christians use this same argument to prove completely different models which is just nonsense.

3 Likes

Sounds like I’m not the one making strong assumptions :smiley:

Not the case whatsoever. The only reason I’ve turned away from evolution in the first place is ID. Before then I was happily on the way to rejecting my childhood Christianity and embracing atheism. Now that ID has convinced me evolution theory may not be as solid as claimed, and I’ve got a little knowledge in the matter, I’ve decided to try and verify evolution for myself, insofar as I can.

As such, knocking down individual pieces of evidence is exactly what I am doing. I have no idea what is an alternative theory, but I don’t believe there’s any need to have an alternative to show the status quo is faulty. And really, what I want is not to disprove evolution, but to find some really solid piece of evidence for evolution. Like as a programmer, if I’m trying to understand the behavior of a new language construct or library, I want to have something solid and repeatable to build my understanding. Additionally, as a programmer, when trying to troubleshoot a bug, I will create a hypothesis, and then try to eliminate the hypothesis with tests. I don’t need to have an alternate hypothesis besides “I don’t know” to debug my code in this way. The only thing worse that “I don’t know” is an incorrect hypothesis, so it is foolish to cling to an incorrect hypothesis just because I don’t have a correct hypothesis.

I’ve yet to find such a thing for evolution, and I’ve been working away pretty dedicatedly over the past year or so. It is strange that such a well established scientific field is hard for a lay person to validate, since the means are readily available with all the genetic data. And it is also strange evolutionary scientists are so allergic to questioning the fundamentals of the field.

Ha! Exactly what I did at first, at the gene level, and showed DAGs produce distinct trees just like genealogical processes do. The feedback was I needed to do this at the nucleotide level with official tools.

Now, I’m not very familiar with the PAUP software, but I think this addresses what you want. I create 100 random trees, run a likelihood test and sort the trees. If the clade structure is the same, then the sorted range should be pretty small, and visa versa.

There is a large DAG dataset that has 26 taxa.
There is a smaller DAG dataset with 18 taxa.
For comparison I have a primate dataset, with 12 taxa.

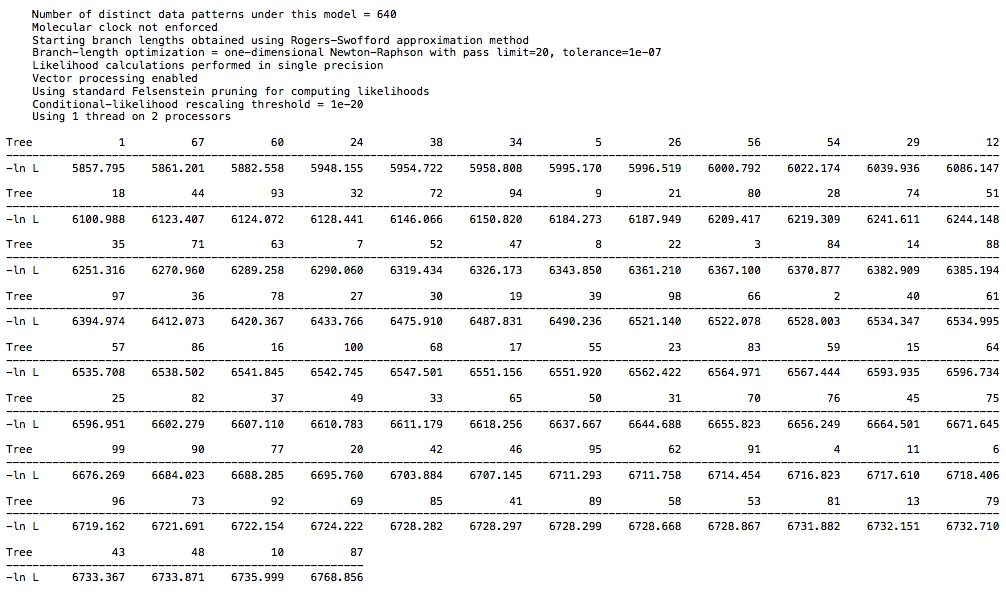
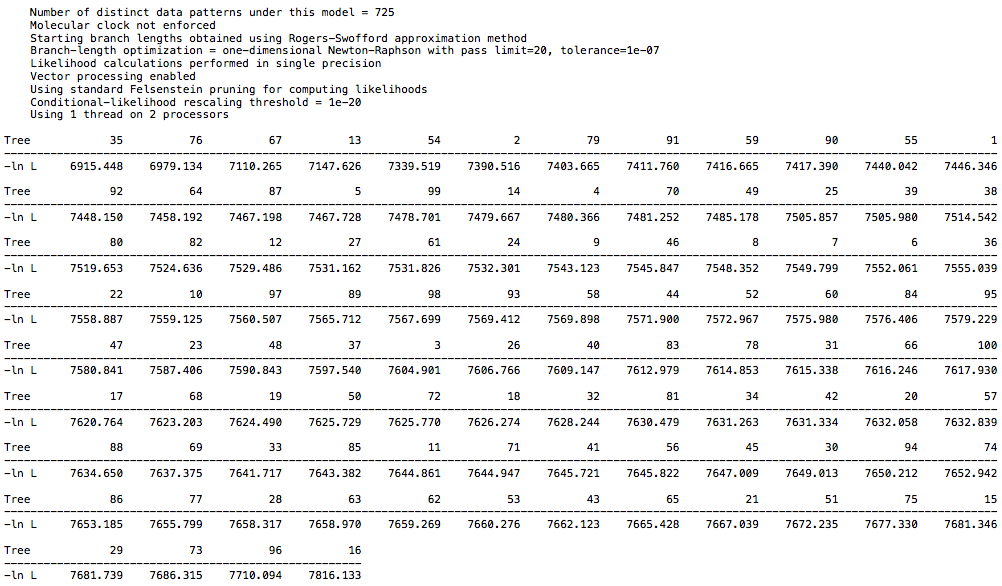
For the primate dataset I have a high score of 7300 and low score of 6394. For the 26 taxa DAG dataset I have a high score of 6768 and low score of 5857. For the 18 taxa DAG dataset I have a high score of 7816 and low score of 6915. The spread is the same in each case, but the larger DAG dataset has a lower overall score, which is to be expected with more taxa. So, there is not a clear difference between the clade structure in real world data and in the synthetic data, at least with regard to CI. I echo @Chris_Falter’s question, is there a different metric you recommend in place of CI? Hopefully a simple one :slight_smile:

Reference results from primate data:


and from the 26 taxa DAG data:

and from the 18 taxa DAG data:

And let me know if you want the datasets to run the analysis yourself.

So do you think this chart counts as good evidence that the genetic data exhibits a nested clade structure?

Screen Shot 2020-10-01 at 7.24.47 PM

@Chris_Falter, for reference, here is the same post over at theskepticalzone.com, where you can see the evolutionary biologist weigh in with their opinions.

http://theskepticalzone.com/wp/fallacy-of-the-phylogenetic-signal-nucleotide-level/

1 Like

Some of the comments are both helpful and incisive, such as corneel’s and Allan Miller’s. Others were more emotive, but even so they point to ways you could improve your presentation. For example, your discussion section could perhaps benefit from a less combative phrasing while still making the same points.

BTW, how do you know who the commenters really are? Is “Flint” a tenured evolutionary biologist, or some random guy/gal? And how would you have confidence in your assessment?

Because I do not really know who the commenters are, I would want to see your paper proceed from informal review at TSZ to a legitimately peer-reviewed publication. (There are plenty of vanity pubs that aren’t really peer-reviewed, not that I know how which ones are good and which are flotsam and jetsam in the realm of biology.)

I hope this comment proves helpful for you.

Peace,
Chris

1 Like

Or just maybe, thousands and thousands of biologists, geneticists, etc. who’ve spent not just a year out of curiosity but decades upon decades of testing ideas and building technologies on the ideas we’ve figured out so far about genetics.

First, it’s a bit of a strawman to suggest that high CI = high support of nested hierarchy. It’s nowhere near as simple as that. For a start, the CI was developed for (binary) morphological data, and it’s not employed on nucleotide phylogenies precisely because it’s not very informative about the quality of the tree.

The CI is sensitive to many different factors in the dataset, and one that appears to be very relevant in the DAG case is the number of gaps in the alignment necessitated by the massive variation in leaf sequence lengths. This produces a highly uneven distribution of character states, inflating the CI.
https://onlinelibrary.wiley.com/doi/epdf/10.1111/j.1558-5646.1989.tb02626.x
(note especially pages 4-5/15)

Entirely random DNA sequence alignments (with gaps) can also produce high CI, but consistently low RCI (rescaled consistency index).
https://onlinelibrary.wiley.com/doi/epdf/10.1111/j.1096-0031.1989.tb00573.x

In both cases, the alignments are obviously completely unlike any seen in rigorous phylogenetic analyses of homologous DNA sequences - i.e. unlike what we see in reality. Extremely low branch support values are consistently found in phylogenetic analyses of random or DAG-based sequences, unlike in analyses of homologous sequences. Mimicking one summary statistic (that is already known to be sensitive) is far from demonstrating that DAGs (or anything else) account for observed data better than an evolutionary process following a nested hierarchy.

4 Likes

Before I forget, who I am: I’m currently teaching at a small university; research focus is on mollusk classification and evolution, so I did calculate consistency indices back in the 1990’s; theological background is Reformed. These days (i.e., in the past couple decades), the consistency index is not used much at all. It is affected by the number of taxa and the number of organisms. By definition, a star tree will have no inconsistencies because it does not indicate any groups that could be inconsistent with anything. So a consistency index is not helpful in assessing a star tree versus a more resolved pattern. In an analysis of a large data set, there are likely to be a very large number of trees that do not differ much in CI. Klassen et al. 1991 (Consistency Indices and Random Data on JSTOR) argued that finding that the CI was above that expected for a random data set of similar size was a useful indicator that there is phylogenetic signal in the data set. But people don’t generally perform phylogenetic analyses on data sets unless they think there is phylogenetic signal, so that’s not very informative. The g1 statistic suffered a similar fate - it measured skew in the tree distribution, but any real data set of interest to phylogeneticists had a reasonable g1 value, and so both of those metrics gradually fell out of use. Instead, analyses focus on the use of analyses such as maximum parsimony, maximum likelihood, or Bayesian analyses to determine what are the best trees. Analyses such as bootstrapping, jackknifing, and decay indices give a rough picture of the degree of support for a particular clade. If the support is strong, that would indicate that the data strongly favor a particular clade versus the alternatives; non-evolutionary ways of generating data (or high enough evolutionary change to have effectively randomized the data) would not be expected to generate much higher support for some groups than others. For example, under a non-evolutionary scenario, taxa A, B, C, and D could each have roughly equal numbers of similarities for each of the others. The ways that A and B match each other would not be expected to necessarily also show up in other pairings - if A and B are similar, in a non-evolutionary scenario, that would tell us nothing about whether similarities between A and C should also be found in B. Another key test of evolution would be whether the patterns found from one data set for a given set of taxa are also found when a different set of data (such as other genes or morphology versus DNA, etc.) is analyzed. Some random variation and homoplasy is expected, but not a complete lack of correlation.

3 Likes

I am less interested in the pseudonym commentators, and more interested in Harshman’s comments, and potentially Felsenstein if he deigns to comment. There are a couple known academics on that forum, the same ones that frequent PS, and perhaps one or two more. That being said, the pseudonym commentators can at least point out specific deficiencies in my analysis, which will be helpful. If my work makes it through a couple forums, then I’ll consider peer review.

I am not so sure making something mimic what we see in reality is the relevant criterion here. The question is whether these metrics are good indicators of genealogical processes, or whether the metrics are also easily swayed by other generation processes. If the latter is the case, it isn’t clear they are good indicators of genealogical processes.

However, if making it ‘look’ like normal alignments we see in the wild is a big deal, I can do that too. It will not be a big adjustment to the simulation. We will see if it makes any difference.

What I would really, really like to find is something quantitative, whether it be a metric, an algorithm, just something, that is supposed to be a reliable, quantifiable indicator of whether evolution has occurred. If you know of a specific such thing, please let me know!

That is exactly what I did above. I showed DAGs produce CI way above the chance cuttoff.

Did you see my response where I did this? Here it is again:

I ran a likelihood analysis on my DAG dataset and compared to a real world dataset, and it was indistinguishable.

Anyways, can you recommend a specific process/metric I can use that is supposed to reliably indicate an evolutionary process created the dataset?

I had thought this CI thing was a really well established result from the Klassen 1991 paper that analyzed 70+ CI results. But now you are telling me that CI metric is meaningless. So, what do we make of the Klassen 1991 paper and their analysis of 70+ CI results? Is that also meaningless?

The field of evolutionary science is really confusing!!!

That would be a start, but if you want your results to be meaningful and be able to interpret them accurately, you should try reading some of the numerous papers discussing merits and pitfalls of the CI, rather than taking it to be either an infallible “magic number” or utterly meaningless. You should also recalibrate the significance cutoff if you want to use nucleotide data, bearing in mind that the random data generated by Klassen was binary morphological data. It does make a difference.

I imagine many things would be confusing if you make no effort whatsoever to understand them. It’s almost as though reading one paper isn’t going to give you a detailed understanding of a subject in a field you’re mostly unfamiliar with.

3 Likes

I’m just going off what the Talk Origins page literally says. Perhaps I am too literal in my interpretation, and there is a lot of unstated qualification.

phylogenies based upon true genealogical processes give high values of hierarchical structure, whereas subjective phylogenies that have only apparent hierarchical structure (like a phylogeny of cars, for example) give low values

One widely used measure of cladistic hierarchical structure is the consistency index (CI). The statistical properties of the CI measure were investigated in a frequently cited paper by Klassen et al . (Klassen et al . 1991; see Figure 1.2.1). The exact CI value is dependent upon the number of taxa in the phylogenetic tree under consideration. In this paper, the authors calculated what values of CI were statistically significant for various numbers of taxa. Higher values of CI indicate a greater degree of hierarchical structure.

I create a simulation where a non genealogical process creates data that measures a very statistically significant level of CI, thus directly falsifying the literal reading of the above.

Again, I cannot address any unstated qualifications to the above, all I can address is what is stated literally, and as such it is provably false.

As for the binary morphological data, that was my first approach, and it scored even higher CI values that were way outside the published values for the various number of taxa. This nucleotide approach was merely to address the criticism that I had not done my analysis at the nucleotide level. Now that I’ve done both I rest my case.

You are being too literal. Given that the article specifically cites the Klassen paper, which shows the type of simulated data that generates low CI in contrast to real data, it’s not hard to understand the intent.

As I said earlier, one major reason you are getting high CI values is because the DAG nucleotide datasets, by their very nature, contain vast amounts of missing character information in them, producing extremely uneven character distributions. This is totally different to realistic sequence data.

If you want to argue that DAGs are a better explanation of what we see in nature, you need to get DAGs to match all the relevant characteristics of that data, not just a single one while disregarding all the rest. Produce a DAG-derived dataset that produces high CI and simultaneously mimics real-life data in its properties, then you might have an interesting result. Simply exploiting known limitations of the CI using a Lovecraftian monstrosity of a dataset isn’t impressive.

3 Likes

Any tips on what these properties are? The only one I can think of that I’m missing is the genes have big gaps between them during the alignment. That’s simple to fix, and I’m doubtful it’ll change the result. Otherwise, I’ve addressed the criticisms I’ve received here and in other forums:

  1. use a standard metric - I used CI

  2. use a standard null hypothesis - I used Klassen 1991 CI cutoff values, and plotted my results on their chart

  3. show the tree is well supported - I ran PAUP’s bootstrap and produced well supported branches

  4. show the random trees have significant divergence in structure comparable to real world data - I ran such a test comparing to a hominid dataset and posted my results higher up in this thread, showing my results have the same range of structure as a real world dataset that we are most confident has been produced by a evolutionary tree

  5. create a nucleotide level analysis - done, per our discussion here

Let me know if you can think of any other properties I’m missing, or if you can recommend some papers. I’ll keep examining the literature.

Even better, show me where in the literature someone has undertaken a similar analysis to my own, running standard tests for phylogeny on DAG generated datasets. I’ve not been able to find any such study, so it appears my work is the first of its kind.

That’s the biggest one to solve up front. After you’ve done that, we can look and see what the other problems might be.

Do you understand why you can’t compare results from Klassen’s binary datasets with these nucleotide datasets? Playing around with different datasets it appears that simply going from a binary dataset to a quaternary dataset, keeping everything else the same, produces ~2x higher CIs.

Can you post the original data you used there?

One other thing it’s worth pointing out is that you’re not actually performing a phylogenetic analysis in PAUP, based on how you’ve described your steps. You load the nexus file then click “generate trees”, but this simply generates 100 (by default) random trees based on the data. When you then click “describe trees” and select tree 1, this is just describing the first of 100 random trees. To generate a rigorour phylogenetic tree, you need to laod the nexus file, then use one of the search options in the “analysis” tab. You’ve said that when you use the bootstrap option it asks you if you want to increase the number of trees, and that you click “no” because otherwise it runs forever. This shouldn’t happen. It’s simply asking you if you want to increase the number of trees saved, and there’s no reason to do that in this case, so clicking “no” is the correct choice, but the analysis doesn’t run forever, it just runs until the number of bootstraps you chose have been completed (default 100). On my computer that takes less than a minute with these small datasets.

I certainly don’t get well-supported branches when I run bootstraps of DAG-derived trees. Here’s one I got as an example:


It’s also worth noting that I consistently failed to get a high rescaled consistency index (RCI) with the DAG-derived trees.

2 Likes