Why I remain a Darwin Skeptic

So again, further explaining why and how I completely agree with this statement above (if we’re speaking in the scientific and not theological realm, of course). So continuing my ever increasingly convoluted ten commandments illustration…

  1. So now assume that our archaeologist had indeed discovered a fragment of the original tablet of the law, but now add that he discovered something that he felt might indeed be evidence of something extraordinary… perhaps let’s say he had the tablet analyzed, and crystallization or evidence of melting around the Hebrew letters confirmed that it had in fact been burned into the stone and melted the parts of it reflecting Hebrew letters. But indeed, his colleagues confirm that the burned Hebrew letters were caused by a flame that exceeded 6000F . Now, consider his dilemma… he knows that the ability to produce so hot, and so precise a flame simply did not exist at the time and provenance of this tablet. Short of positing the idea that humans had secretly discovered and quickly lost advanced welding technology some 3000 years ago, he knows that these Hebrew letters inscribed in the stone are simply not “man-made”. Now let’s say that this archaeologist now personally embraces a belief (rightly, given my hypothetical scenario) that this was in fact the original stone tablet inscribed by God directly.

Now, here’s the main question: What can he say scientifically at this point?? What would his scientific approach allow him to do? What can he publish in a scientific peer-reviewed journal of archaeology? I suggest he could still do the following and remain squarely in the realm of science - even in light of his personal belief that God was in fact the direct agent who carved these particular words…

  • he could still maintain (just like in 1, 2, and 3 above) that the markings on the rock reflected intelligent, purposeful agency. His (personal) belief about the identity of the particular author or inscriber of those Hebrew words in no way keeps him from recognizing intelligent agency behind those words, nor would his personal belief render his recognition of intelligent agency behind Hebrew words as “unscientific”. So this recognition, of intelligent agency or purpose, in itself, is squarely in the realm of science. If he were to argue that the specific identity of this author were divine or supernatural, then indeed at that point he would cross into the realm of theology or metaphysics. But I submit that his basic recognition of Hebrew words as intelligently caused is just as “scientific” in this case as it would be in 1, 2, and 3 above.

  • He could also recognize, and publish in a scientific journal, that no known human agency extant at the time could have carved those particular markings, given what was determined about the nature of the heat that melted/burned them into this stone. Given my hypothetical scenario, this in itself would be a simple and accurate and most scientific statement. Now, this observation may indeed have theological implications, but the observation itself is still squarely in the realm of science. science, natural history, etc., knows of no historic human technology or process that could have caused such phenomenon. And recognizing that the phenomenon is not explicable by certain hypotheses would remain squarely within the realm of science.

I maintain that those two claims could indeed be made, scientifically, and uncontroversially, even while my hypothetical archaeologist held theological views wherein he in fact believed that the ultimate cause of the phenomenon was in fact divine or supernatural. Neither of these observations is trying to use science “on the supernatural” or to draw supernatural conclusions from natural premises, etc.

What he could not say scientifically is any form or variation of the following:

  • This proves that God was the one that carved these inscriptions in the stone.

Hence why I am fully in agreement with what you wrote above: One can not “scientifically detect that this work was done by a supernatural or divine being and not say advanced alien life.” In my hypothetical scenario, undiscovered alien life would by just as “possible” an explanation that covered the relevant facts as a supernatural hypothesis. And no “scientific” method or evidence, itself, could rule out the one in favor of the other.
If he did conclude (even personally and privately) that God were the one who inscribed this tablet, that is and would remain a theological claim, one that could not be embraced or claimed as a scientific conclusion.

But my claim is that 1) his recognition of intelligent agency, and 2) his ability to rule out certain natural explanations, are both squarely within the realm of science even if these scientific observations had theological implications

So…

I hope you can see how and why we agree 100% on that point… but also why I believe one should not do science or methodological naturalism in a way that rules out or precludes the ability to see design, or which rules out a design hypothesis a priori, simply because one might in fact believe the said designer to in fact be God?.

2 Likes

Thanks for laying it all out, Daniel. Now that I have it all, so to speak, I’ll have a reread of your whole idea in order. Thanks again. :+1:

1 Like

The alternative, is that in the early Cambrian, God created the “living” organisms, those with life blood as described in Genesis. But much of the world was in anoxic and sulfuric conditions, so we see the prevailing lifeforms in the fossil record. We do not see the rare locations like the Siberian Highlands from whence trilobites and other more complex lifeforms radiated out in waves when the world became increasingly less anoxic, less sulfuric, and more terrestrial.

Currently we do not observe evolution on a genetic level as we should, yet we do observe radiations of species when conditions in an area change. It is this simple observed process that explains the fossil record.

You may say that this theory is missing an “Island” or “oasis” of multiple advanced life forms during the Cambrian. Yes we should be looking for this oasis of life that I will call the island of Eden, rather than trying to find millions of transitions. This would possibly be found in deep locations in the Middle East and the Siberian Plateau.

Who determines whether a mutation is beneficial or not? Does science? So I? Does the species? Does it have a big sign on it? No.

Only Natural Selection can determine whether a mutation is beneficial or neutral and if so it is selected in. If not, it is selected out. If there is no selection, if it is truly random regardless of being beneficial, then the chances are that the mutation will be detrimental. Is there ANY evidence that the majority of these 95% mutations are detrimental? In other words is there any evidence that humans are more poorly adapted to the environment than the chimpanzees. Please disregard the past 4 years.

The first thing to note is that you appear to be trying to reproduce only the 4-category plots from that article, not the 7-category plots. This makes any success less interesting.

On to what you did… I don’t think the Levenshtein edit distance between two random strings is a particularly good model for comparing two nearly identical genomes, but I also doubt it matters very much. So let us proceed.

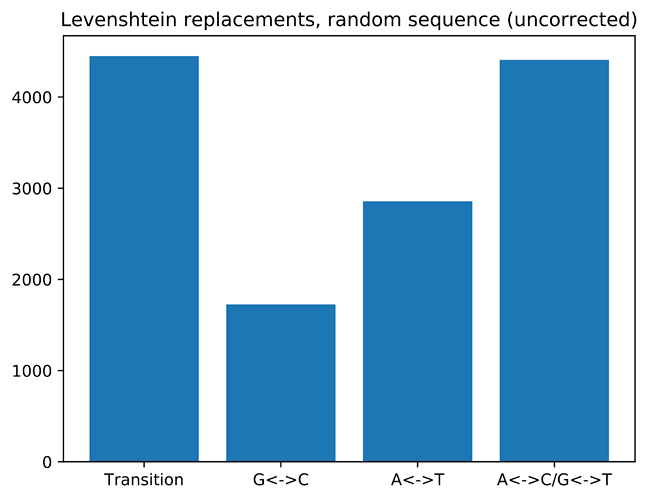
I repeated your procedure, assuming I understand it correctly. That is, I generated pairs of random strings of length 100, each consisting of ‘a’, ‘c’, ‘g’, and ‘t’ with frequencies determined by the GC content (which I take to be 41%, the value for humans, for both). I calculated the Levenshtein edits (or rather, I let a package do it for me), pulled out all of the single-character replacement edits and tabulated them based on the four categories in the original plot. Raw counts of these fall out like this:


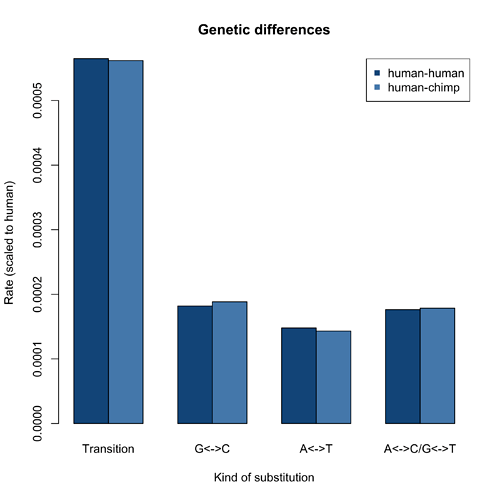
Is that what you saw? For comparison, here’s the figure based on real data:


I don’t think there’s any sense in which the random comparisons recapitulates the actual result. Note that the first and last columns are higher because they have roughly twice as many starting bases to work from and will therefore have roughly twice the total number of substitutions – not a particularly interesting finding.

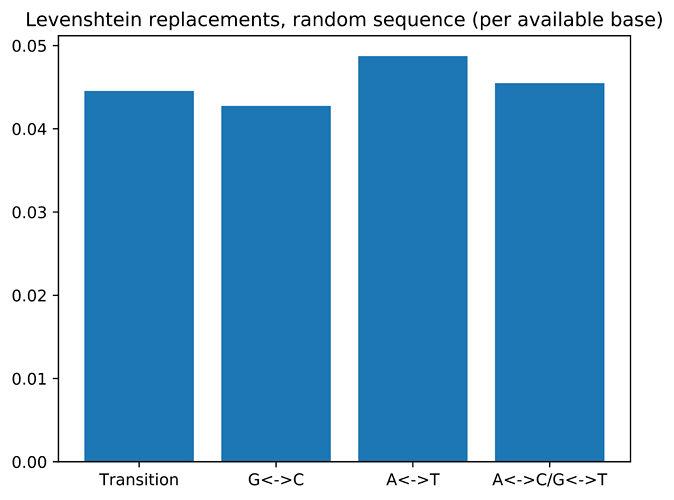
Which is why what’s actually plotted for the real data isn’t the raw number of substitutions but the number per available base – that’s what we should be looking at. When I do for the simulated random sequences, I find this distribution:


which looks even less like reality. So no, unless I’ve made a mistake here somewhere, this attempted non-mutational explanation for the observed pattern of differences fails.

To me it makes as much sense to say here as most places I see it said, so sure, go for it.

No comment.

6 Likes

And if anyone wants to check my work or just play along at home, what I did was install the Levenshtein python package (‘pip3 install python-Levenshtein’) and run the following code:

#!/usr/local/bin/python3 
import Levenshtein as lev
import matplotlib.pyplot as plt
import random

def main() : 
  gc_content = .41                                                                                                                       
  niter = 1000    
  k = 100                                                                                                                                 
  ngc = nat = nmixed = ntransition = 0                                                                                                   
  for it in range(niter) :                                                                                                               
    # pick two strings, each k long, of a, c, g, t, with frequencies determined by gc_content                                            
    al = random.choices(['a', 'c', 'g', 't'], weights=[0.5*(1-gc_content), 0.5*gc_content, 
          0.5*gc_content, 0.5*(1-gc_content)], k=k)     
    bl = random.choices(['a', 'c', 'g', 't'], weights=[0.5*(1-gc_content), 0.5*gc_content, 
          0.5*gc_content, 0.5*(1-gc_content)], k=k)     
    a = ''.join(al)                                                                                                                      
    b = ''.join(bl)                                                                                                                      
    # lev.opcodes does all the work -- it provides a list of edits to turn a into b                                                      
    for tag, i1, i2, j1, j2 in lev.opcodes(a, b) :                                                                                       
      if tag == 'replace' :           # substitutions only                                                                               
        if i2 - i1 > 1 or j2 - j1 > 1 : continue             # single character only                                                     
        if a[i1] == 'c' and b[j1] == 'g' : ngc += 1                                                                                      
        elif a[i1] == 'g' and b[j1] == 'c' : ngc += 1                                                                                    
                                                                                                                                     
        elif a[i1] == 'a' and b[j1] == 't' : nat += 1                                                                                    
        elif a[i1] == 't' and b[j1] == 'a' : nat += 1                                                                                    
                                                                                                                                     
        elif a[i1] == 'a' and b[j1] == 'c' : nmixed += 1                                                                                 
        elif a[i1] == 'c' and b[j1] == 'a' : nmixed += 1                                                                                 
        elif a[i1] == 'g' and b[j1] == 't' : nmixed += 1                                                                                 
        elif a[i1] == 't' and b[j1] == 'g' : nmixed += 1                                                                                 
                                                                                                                                     
        elif a[i1] == 'c' and b[j1] == 't' : ntransition += 1                                                                            
        elif a[i1] == 't' and b[j1] == 'c' : ntransition += 1                                                                            
        elif a[i1] == 'a' and b[j1] == 'g' : ntransition += 1                                                                            
        elif a[i1] == 'g' and b[j1] == 'a' : ntransition += 1                                                                            
                                                                                                                                     
        else : print('huh?', a[i1], b[j1])                                                                                               
                                                                                                                                     
  print(ngc, nat, nmixed, ntransition)                                                                                                   
  fig, ax = plt.subplots()                                                                                                               
  types = ['Transition', 'G<->C', 'A<->T', 'A<->C/G<->T']                                                                                
  ntot = niter * k                                                                                                                       
  counts = [ntransition, ngc, nat, nmixed]                                                                                               
  rates = [ntransition/ntot, ngc/ntot/gc_content, nat/ntot/(1-gc_content), nmixed/ntot]                                                  
  ax.bar(types, rates)                                                                                                                   
  ax.set_title('Levenshtein replacements, random sequence (per available base)')                                                         
 #  These give the uncorrected values:                                                                                                    
 #  ax.bar(types, counts)                                                                                                                 
 #  ax.set_title('Levenshtein replacements, random sequence (uncorrected)')                                                               
                                                                                                                                     
  fig.savefig('lev.pdf', bbox_inches='tight')                                                                                            
                                                                                                                                     
main()
2 Likes

Steve, I’m very grateful for you posting this information. I’ve read it through a few times but I admit it is a little over my head. I was wondering if you would be kind enough to explain your two charts and their significance in an ELI5 way? (Explain like I’m 5)

Sorry, and thanks in advance. :see_no_evil:

So, happy to show and tell, B.Sc.(Hons.) in Biological Sciences, Lancaster (the original Roman one), '75

London Hospital Medical Centre, Whitechapel, Oral Microbiology Unit, laboratory technician, '80.

They have an outstanding pathology collection. Including the Elephant Man who lived there, his heart breaking, ghastly, sci-fi horror skeleton and that of a syphilitic. Green. Every human body part with every kind of morbidity. Only one put me off my lunch. Not the worm bored Swiss cheese brain. A tumourous foot.

I can tell the life science post grads here. And non.

The oxygen level was 63% of current. Not zero extensively. And where do you get sulphurous from?

How should we observe evolution at the genetic level that we don’t? How don’t we?

Sure terrestrial conditions would have had more oxygen, but marine conditions were largely anoxic in the Ediacaran.

That link explains the widespread anoxic and then sulfuric conditions in the late Ediacaran and early Cambrian. Then later the oceans became less sulfuric.

The theory of evolution lacks transitionary fossils, the theory of creationism lacks the discovery of an oasis of life forms suited to a non anoxic, and non sulfuric ocean during that transition. Both theories are lacking fossils. We need to look for rare marine environments that were non anoxic and non sulfuric before we can conclude that a large range of extant species did not exist then.

In terrestrial environments, as you say oxygen levels were very high. They would be toxic actually to most extant species. If one is to assume that extant terrestrial species didn’t exist back then, one first has to extensively research terrestrial areas of non toxic oxygen levels, suitable to today’s fauna/flora. ie high elevations where oxygen levels were lower.

A further influencing factor was co2. Some plants prefer higher co2, some don’t. Does this mean that those that don’t, did not exist back then? Or possibly they were in niche locations, and expanded out when conditions changed. This is what we observe today, niche organisms can dominate an eco-system when the environment changes.

Evolution does exist on a genetic level, but it’s mainly due to changes to allele frequencies with the occasional mutation. These changes can cause dramatic changes to an organism, but not via additional unique genes added to the genome, as often surmised by evolution. This evolutionary process of additional unique coding genes which improve fitness, is rarely observed, if ever.

I feel like we’ve been before @mindspawn

Just checking A. We’re going to hear some new ideas and not going to rake over old ground, B. We’re going to keep the conversation around ID - Which is what this thread is about :slightly_smiling_face:.

1 Like

A) evolution isn’t a new idea, neither is creationism. Sure some old ideas will come up here and there, it’s unavoidable.

B) ID is core to my position. The interpretation of the fossil record and comparisons between the 2 theories are relevant when discussing ID. Does the TOE contain any advantage over ID when looking at the fossil record? That is my core focus. If most species appeared suddenly without precursor, this would point to ID.

C) it is a rule of this site that a thread can close if inactive for a week. I’m often inactive for a week. I see no reason to prohibit revisiting previous topics not fully discussed.

I simply wanted to check we weren’t going to rehash the thread I linked to.

Do you have any new evidence to support your hypothesis since the last time you raised it (in the linked thread)? Genuine question.

I’m sure some of my views expressed before will come up here, but the emphasis is different. Previous focus was specifically the Cambrian Explosion, my focus this time is on general environmental changes, and the search for niche environments from which radiations of rare species would dominate earth in waves. One would expect this, through observation of changed eco systems today.

We will happily open a closed thread for you if you would like to return to it. Just message the moderators.

1 Like

Thanks, I never knew that. I’m happy to continue old discussions here, but if the moderators prefer, we could open an old thread. Liam doesn’t seem to like the idea of continuing old discussions here, I don’t see the problem with it, as long as it retains some relevance to the opening post.

It would be better to start a new thread. We are already on post 577. If you would like it linked to this one, click on the time stamp in the upper right of a post in this thread and click on the + new topic to start your new thread.

Noted thanks. I will possibly do so in the next few days.

I’ll reply on the Zombie thread on claims of divine intervention (but not ID?) in the Cambrian.

I can try. If you’ve read my original blog post, you know its point: the pattern of genetic differences between humans and chimps is the same pattern you see between individual humans, and that both patterns represent accumulated mutations. So if you have a T at a certain spot in your genome and my base is different, mine is more likely to be a C than an A because C and T mutate into one another more readily than A and T.

‘Not so fast’, says @EricMH: that pattern doesn’t have to come from mutations. It could just reflect random differences between the genomes, with the pattern governed by the composition of the genomes. (Note: both the human and the chimpanzee genomes consist of 41% Gs and Cs and 59% As and Ts.) To test this idea, he generated random fake genomes with the appropriate composition and compared them. To make the comparison he used a calculation of the Levenshtein editing distance, which determines the minimum number of edits (insertions, deletions, substitutions) to turn one string (e.g. the letters of a genome) into another string; from that calculation, he pulls out the substitutions (also called replacements). You can take this to be kinda, sorta like the process of aligning human and chimp DNA and identifying single-base differences between them; those differences were what I used to determine the patterns in my blog post. He said that the resulting pattern of substitutions looked a lot like my pattern, showing that you don’t have to invoke mutations to explain the pattern.

The problem is that, when I tried to do exactly what he described, I ended up with the two plots you’re asking about. The first one represents what it sounds like Eric did, which is to tabulate the number of differences of each kind. That’s not going to be very interesting, in fact, since different categories in the plot have different opportunities to occur. For example, to get into the A<->T column, genome 1 can have an A ant genome 2 a T or vice versa, so only As and Ts can contribute to that category. To get into A<->C/G<->T, on the other hand, you can start with any of the four bases: the two genomes could have A:C, C:A, G:T, or T:G. So there are roughly twice as many opportunities for these differences, and that column is going to end up about twice as high A<->T. When you correct for that effect by dividing the A<->T by the number of As and Ts (and do the same for C<->G), you end up with the second plot, which looks quite uninteresting and nothing like the real distribution seen in data.

3 Likes