Probably 1%. That’s the traditional threshold, but I rarely see it referenced these days, and the meaning of “SNP” has broadened to include any single-nucleotide substitution (and sometimes other things too). 10M is in the right ball park for >1%, though probably a little low. The 1000 Genomes project Phase 3 paper breaks them down differently: 8 million variants (predominantly SNPs) at >5% frequency, 12 million 0.5% - 5%, 64 million <0.5%.
I don’t think a back-of-the envelope calculation will do the job. It’s not the number of SNPs that’s carries most of the information about demographic history: it’s the frequency spectrum. That’s primarily what’s used to determine bottleneck size.
I’m using a simple forward-time Monte Carlo, slightly varied from a program I wrote for a paper a couple of years ago. (And I also have zero training in population genetics, apart from the on-the-job variety. Don’t let that stop you.)
So here’s what the frequency spectrum shows if you compare your young population model with an old population version that’s otherwise the same, along with some West African data from the 1000 Genomes Project:
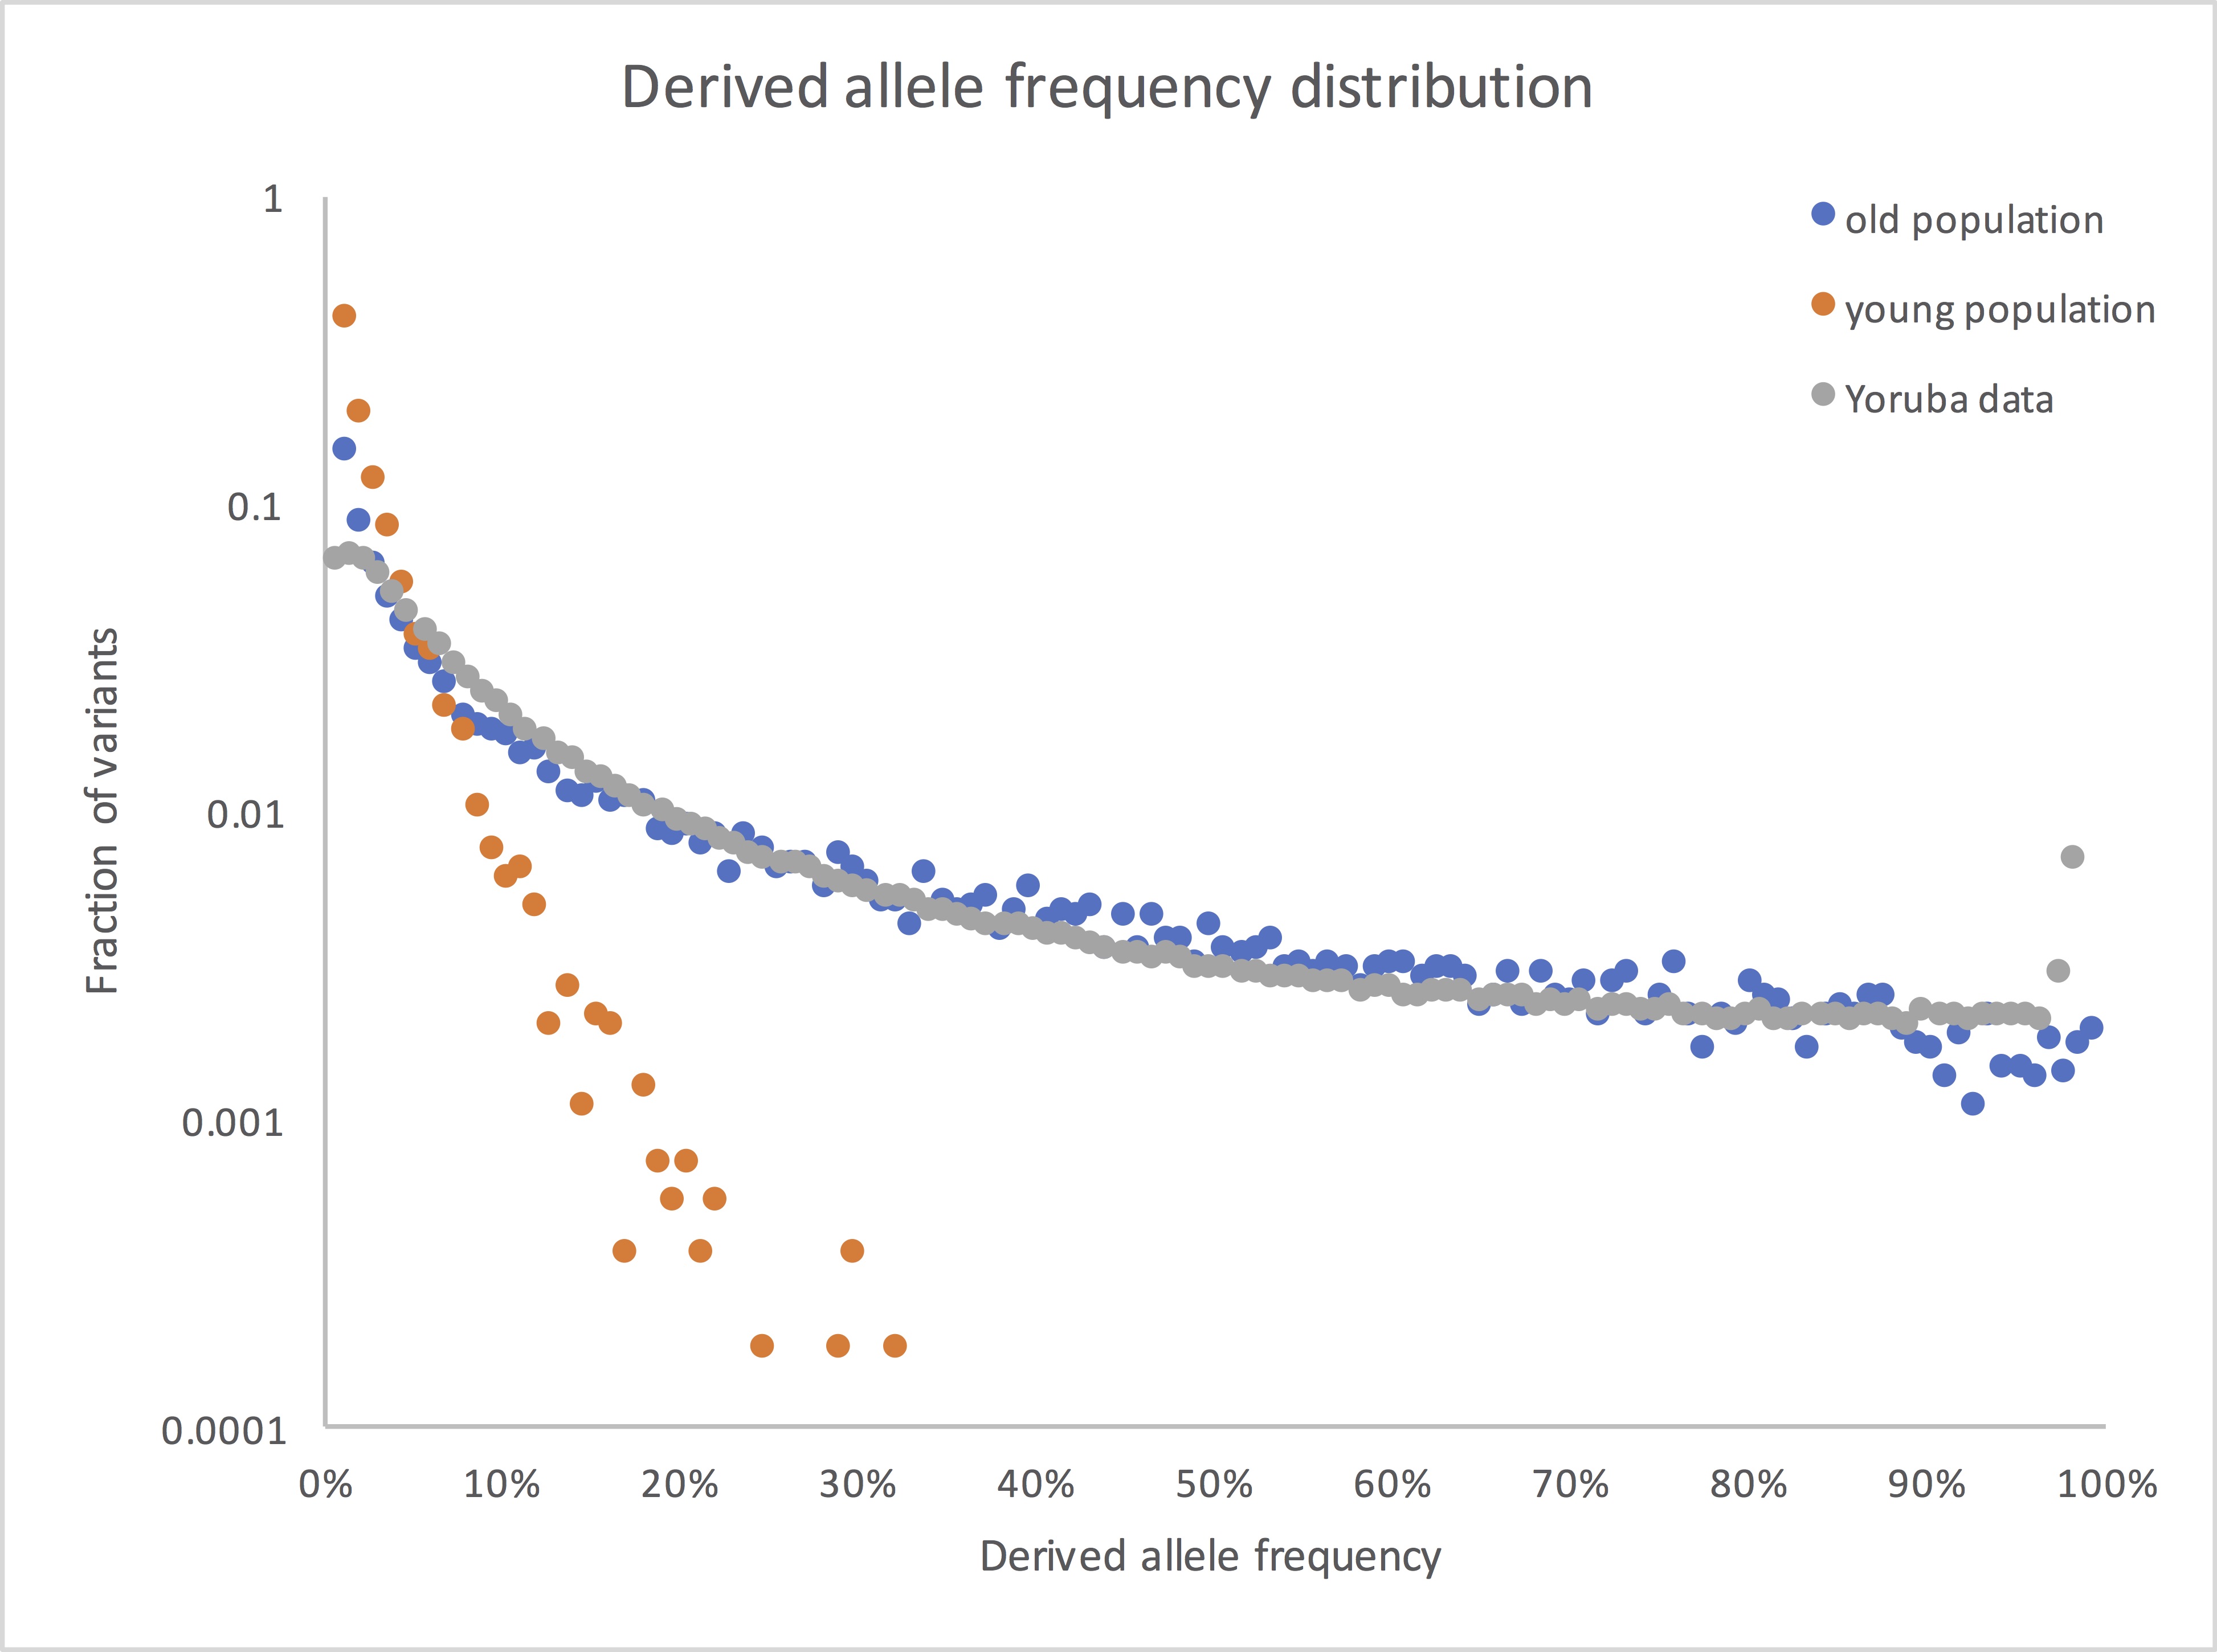
(I’ve dropped the lowest frequency bin, where 1kG had little power to detect variants. I may also have expanded or contracted the x axis for the real data, since I don’t remember exactly what’s in my own file at this point. But the overall picture is accurate: real human genetic variants look old.)