It has always been known that the common descent model fails, both from a long list of particular examples, as well as in systematic studies. But what might a better model be? Winston Ewert’s new paper (Ewert) presents a dependency graph model, inspired by computer science. The paper uses model selection methods, and shows that the dependency graph model is a far superior model compared to common descent.
It was published in BIO-Complexity, which is a journal specifically created to support inteligent design. If it has good enough evidence, why not publish it in a journal of evolution, byophyisics or even mathematics/statistics? (Content edited by moderator.)
3 Likes
Using the HomoloGene dataset, the data were more probable on Dependency Graph, compared to Common Descent, by 10,064 bits. 6.6 bits is considered to be “decisive.” You can follow the data, or be left behind.
Note that Ewert’s approach models the species as sharing modules which are related by a dependency graph. This useful model in computer science also works well in modeling the species. To evaluate this hypothesis, Ewert uses three types of data, and evaluates how probable they are (accounting for parsimony as well as fit accuracy) using three models.
Ewert’s three types of data are: (i) Sample computer software, (ii) simulated species data generated from evolutionary / common descent computer algorithms, and (iii) actual, real species data.
Ewert’s three models are: (i) A null model in which entails no relationships between
any species, (ii) an evolutionary / common descent model, and (iii) a dependency graph model.
For the sample computer software data, not surprisingly the null model performed poorly. Computer software is highly organized, and there are relationships between different computer programs, and how they draw from foundational software libraries. But comparing the common descent and dependency graph models, the latter performs far better at modeling the software “species.” In other words, the design and development of computer software is far better described and modeled by a dependency graph than by a common descent tree.
Second, for the simulated species data generated with a common descent algorithm, it is not surprising that the common descent model was far superior to the dependency graph. That would be true by definition, and serves to validate Ewert’s approach. Common descent is the best model for the data generated by a common descent process.
Third, for the actual, real species data, the dependency graph model is astronomically superior compared to the common descent model.
What his model doesn’t do is model sequence data, which is the data that supports common descent.
“It will be determined to what extent the phylogenetic tree, as derived from molecular data in complete independence from the results of organismal biology, coincides with the phylogenetic tree constructed on the basis of organismal biology. If the two phylogenetic trees are mostly in agreement with respect to the topology of branching, the best available single proof of the reality of macro-evolution would be furnished. Indeed, only the theory of evolution, combined with the realization that events at any supramolecular level are consistent with molecular events, could reasonably account for such a congruence between lines of evidence obtained independently, namely amino acid sequences of homologous polypeptide chains on the one hand, and the finds of organismal taxonomy and paleontology on the other hand. Besides offering an intellectual satisfaction to some, the advertising of such evidence would of course amount to beating a dead horse. Some beating of dead horses may be ethical, when here and there they display unexpected twitches that look like life.”—Emile Zuckerkandl and Linus Pauling, discussing the possibility of the twin nested hierarchy before the first molecular phylogenies had been made. (1965) “Evolutionary Divergence and Convergence in Proteins.” in Evolving Genes and Proteins, p. 101.
Zuckerandl and Pauling wrote this in 1965. As it turns out, DNA sequence is much better for modeling common ancestry and evolution than protein sequence, but given the time frame of the quote it can be understood why they may not have seen this. Nonetheless, the evidence is in the DNA sequences, and Ewert completely ignores it. The evidence for common ancestry and evolution is the correlation between trees based on DNA sequences and trees based on morphology. As Ewert states in the paper:
“Genes within families do undergo splitting, sequence changes, and functional changes. However, such events are below the resolution of the model. This model is only concerned with the presence or absence of the gene family in a particular species. However, a gene may evolve into a new gene family. The assumption of the model is that a particular gene family can only arise once, whether de novo or from an existing gene family.”
If sequence changes are below the resolution of his model then his model is useless for the task he is using it for. Period. It is the actual sequence data that his model needs to explain, and it doesn’t.
1 Like
I don’t work with cladistics, so I can’t really evaluate the methodological reliability of the paper. My only question is: If the model is so good and reliable, why hasn’t it been published in a evolution, cladistics or bioinformatics journal, but rather in a journaln specifically aimed at promoting ID? I don’t mean to be rude, but of the authors are not willing to do that I’m going to spend time analyzing it. It is also worth mentioning that you can get pretty much any result you want by designing a study poorly, and if that is not the case, why publish it in a biased journal?
3 Likes
The problem is that Ewert’s model doesn’t even touch on the evidence found at Homologene. One of the pieces of evidence found at Homologene is the sequence data. One of the features of this data is genetic equidistance. This is best seen in a trio of species. Let’s look at humans, mice, and chickens. According to the theory of evolution and common descent, mice and humans share a more recent common ancestor than humans and chickens. More importantly, the common ancestor of humans and chickens is the same common ancestor for mice and chickens. Therefore, according to the theory of evolution, both humans and mice are equidistant from chickens since the human/mouse lineage and the chicken lineage meet at the same common ancestor.
So what does this mean for the sequence data? This means that the genetic distance between the human and chicken genome should be about the same as the genetic distance between the mouse and chicken genome. Is this what we see? Let’s look at the DNA sequence for cytochrome c (cycs) for all three genomes and see how they compare.
Human v. mouse = 90.5% similar
Human v. chicken = 81.6%
Mouse v. chicken = 81.9%
We see genetic equidistance. How does Ewert’s model predict this? If it doesn’t predict this relationship, or is incapable of predicting this relationship, then it is a useless model because it doesn’t deal with the data.
3 Likes
You know, YEC people who visit here often talk about the way they perceive those in the evolutionary creationist camp as talking down to them. Now I know how it feels! I think that’s a good thing, for building empathy with those I disagree with.
And those comparisons have failed badly. Phylogenies based on different characters, and sets of characters, have been found to be incongruent. This has been found to be a major problem, notwithstanding quotes from 1965. ![]()
Now I’ll be the first to agree that it will be interesting to use more data in tests of new models, such as dependency graph. But a monumental problem with the high claims of evidence for evolution / common descent provided by molecular sequence data (aside from the fact that later, more complete, studies have confirmed CD’s failure on these data) is the theory-ladenness inherent in the preconditioning and prefiltering of said data which routinely goes on. Simply put, uncooperative data and methods are filtered out, and the “right answer” is baked into the cake.
I have discussed this many times at my blog. I’ll resurrect some examples if you are interested, but the insistence of using sequence data is, in itself, such an example. The problem is, homologous sequences don’t even exist in some genomes that you’d like to include. Evolutionists simply drop them from the character set altogether, and say it doesn’t matter!
Now to be sure, some studies have used gene homology presence/absence. Ewert’s data type certainly has precedent. So what we know is that common descent has failed on sequence comparisons, and on data that can be used on a broad scale (homology presence / absence) common descent has not only failed again, but we have a different model that is astronomically superior.
The incongruencies are where we would expect to see them due to ILS and homoplasies. We never see mouse genes falling in the jellyfish group and not in the same group with other rodents, as one example. The incongruities are very small compared to the overall tree.
Examples?
Why would it matter? Deletion mutations are part of the evolutionary process.
Except that it hasn’t. The phylogenetic signal is much stronger than the noise caused by mechanisms such as ILS and homoplasies. There is a statistically significant phylogenetic signal in the sequence data that needs to be explained. and Ewert’s model runs away from it.
Yet another problem that Ewert’s model faces is the divergence of exons and introns within the same gene. Exons are the functional bits of a gene that are stitched together to make mRNA which is then translated into protein. The introns are simply snipped out. There are a few introns that serve other functions, such as carrying microRNA sequences, but the vast bulk of introns serve no function and are considered junk DNA.
What predictions does Ewert’s model make? The idea is that a designer would just copy over the parts of a gene that would serve the same function in the new species. For the vast majority of intron sequence, the same exact sequence would serve the same function, as RNA that is edited out during mRNA processing. The exons, on the other hand, would need to be change in order to serve different functions or similar functions in different species.
Therefore, using Ewert’s model, we would expect that if we compared orthologous genes between species that we would see more differences in exons than in introns. We also shouldn’t see any pattern of divergence in introns that correlates to evolutionary distance since these genes supposedly did not come about through evolutionary mechanisms.
Evolution, on the other hand, makes the exact opposite prediction. Deleterious mutations will occur in functional exons. These deleterious mutations in exons will be selected against. However, it is exceedingly rare for there to be a deleterious mutation in non-functional introns so they tend to accumulate mutations at a much higher rate than exons since fewer of the mutations are selected out of the population. This causes exons and intron sequences to diverge at different rates, with introns having more differences than exons when comparing the same gene between two species.
So what do we see in real life? Ewert’s model completely fails, and the evolutionary model is supported. Here is a comparison of the human MMP9 gene to other vertebrate MMP9 genes:
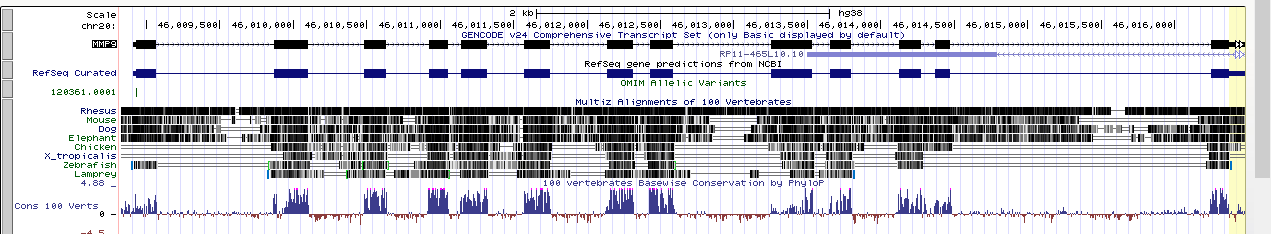
The string with the boxes towards the top of the box is the gene. The boxes are the exons and the line between the boxes are the introns. The next section down is the conservation data for different model vertebrates. Where there is similar sequence there is a black line. The top line is The top line is the rhesus monkey, and most of the human sequence matches up to the rhesus monkey. The lines below that are more distantly related, from mouse, dog, elephant, chicken, frog, and fish. As you increase the evolutionary distance from the human sequence there is less and less sequence similarity in the introns, but still conserved sequence in the exons. Again, the exact opposite of Ewert’s model and exactly what we would expect from evolution.
Below the black bars is the summary of sequence conservation for 100 model vertebrate species. The places where the histogram spikes up are regions of sequence conservation. Again, these align very well with the exons, and not with the introns where the sequence conservation should exist in Ewert’s model. Again, this is exactly what we would expect from evolution, but not from Ewert’s idea of reusing sequence like is done in software engineering.
Along with the overwhelming phylogenetic signal found in the overall sequence data that Ewert ignores, there is also the exon/intron data that he needs to explain. At least to my eyes, it completely falsifies Ewert’s model.
3 Likes
Let’s also look at the claim made by Ewert that genetics follows function. The picture below is the (now extinct) Tasmanian wolf:
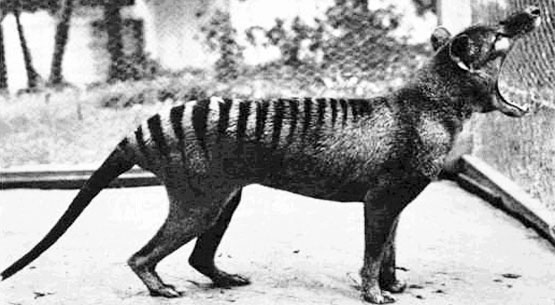
According to Ewert’s model, the genetic sequences of the Tasmanian wolf should be closer to the North American wolf than to humans. Surely, right? Is that the case? Nope.
When we compare genes from humans, Tasmanian wolves, and North American wolves the human and North American wolf genomes share more DNA than the Tasmanian and North American wolf. Of course, evolution does explain this. Humans and North American wolves, both of whom are eutherians, share a more recent common ancestor than the North American and Tasmanian wolves which is a thylacine (i.e. marsupial). This is why human and North American wolf DNA is more similar. Ewert’s model makes the exact opposite prediction, and fails.
5 Likes
Sure, here are a few examples of theory-ladenness in evolutionary thought. Here is a prominent study that identified “the vast majority” of the orphans in the human genome as “spurious.” But there was no scientific evidence that those human sequences, identified as orphans, were “spurious.” The methods entailed evolutionary assumptions.
Here is a paper that attempted to compute the evolutionary tree relating a couple dozen yeast species using 1,070 genes.
The tree that uses all 1,070 genes is called the concatenation tree. They then repeated the computation 1,070 times, for each gene taken individually. Not only did none of the 1,070 trees match the concatenation tree, they also failed to show even a single match between themselves. In other words, out of the 1,071 trees, there were zero matches. It was “a bit shocking” for evolutionists.
What is interesting is how this false prediction was accommodated. The evolutionists tried to fix the problem with all kinds of strategies. They removed parts of genes from the analysis, they removed a few genes that might have been outliers, they removed a few of the yeast species, they restricted the analysis to certain genes that agreed on parts of the evolutionary tree, they restricted the analysis to only those genes thought to be slowly evolving, and they tried restricting the gene comparisons to only certain parts of the gene.
These various strategies each have their own rationale. That rationale may be dubious, but at least there is some underlying reasoning. Yet none of these strategies worked. In fact, they sometimes exacerbated the incongruence problem. What the evolutionists finally had to do, simply put, was to select the subset of the genes that gave the right evolutionary answer. They described those genes as having “strong phylogenetic signal.” And how do we know that these genes have strong phylogenetic signal? Because they gave the right answer. As one evolutionist put it, “if you take just the strongly supported genes, then you recover the correct tree.”
It is another example of the general problem of prefiltering of data, and how well accepted it is, because the theory justifies it.
Here is a paper on the pervasive problem of phylogenetic incongruence and “gene tree reconciliation.” The paper admits that data are routinely filtered in order to satisfy stringent criteria so as to eliminate the possibility of incongruence.
https://www.sciencedirect.com/science/article/pii/S0169534713002139
But even prefiltering cannot always help the theory. For even cleansed data routinely lead to evolutionary trees that are incongruent. As one study explained, the problem is so confusing that results “can lead to high confidence in incorrect hypotheses.”
I hope that gives you a hint at the magnitude of this problem, and how “supporting” evidence for evolution is carefully selected.
Oh gosh no, this isn’t even close. Phylogenetic incongruencies are far more pervasive and massive than was ever expected. And as for mice, I don’t know about jellyfish, but the UCEs (ultra conserved sequences) in mice have been found in a wide range of species where they shouldn’t have been.
I don’t see how that relates to what you said before:
“But a monumental problem with the high claims of evidence for evolution / common descent provided by molecular sequence data (aside from the fact that later, more complete, studies have confirmed CD’s failure on these data) is the theory-ladenness inherent in the preconditioning and prefiltering of said data which routinely goes on.”
If you are referring to using sequence conservation as a test for function, then this isn’t an evolutionary assumption. This is using a conclusion. Common ancestry and evolution aren’t assumptions. They are conclusions drawn from massive data sets.
Homoplasies can mask the phylogenetic signal for ancient divergences when there is a lack of modern DNA data to work with. This is what we should see if evolution is true.
At the same time, none of these analyses has one species of yeast being placed in the ape lineage or in the mouse lineag, away from other yeast species. In a design model, there is no reason why a designer could not put mammal sequences in yeast species. In fact, humans do that all of the time. With the design model we should see massive divergences away from the expected phylogeny, not small incongruencies at deep nodes as we would expect from homoplasies. If you read the abstract, it shows the exact pattern we would expect from evolution:
“Incongruence severity increased for shorter internodes located deeper in the phylogeny.”
That’s where the incongruencies should be if evolution is true.
Again, the incongruencies are in the fine details of the tree where we would expect to see them if evolution is true.
These are all claims that need to be backed up with evidence. Can you show me a gene that is 100% conserved in mice and in jellyfish but is not found in any other vertebrate?
Well this certainly is a telling response. It shows how anything goes. You can have a third of the genes be unique (even compared to allied species!), and it counts for nothing. There is no empirical content here. Between homoplasies, incomplete lineage sorting, deletion mutations, drift, strong selection, horizontal gene transfer, etc., etc., practically anything can be explained. So why not just throw out whatever data doesn’t fit?
Because mutations happen. You are aware that the theory of evolution includes changes in DNA sequences, right? Mutations producing unique sequence is exactly what we would expect to see.
No, it can’t. These processes couldn’t explain massive incongruencies, such as mice grouping with jellyfish instead of with other rodents. However, with design such incongruencies should be seen all over the place, but they aren’t.
Well you are making my point. Common ancestry and evolution are conclusions drawn from massive data sets, so prefiltering is justified, and thereby we have yet more confirming evidence. Disconfirming evidence is not allowed.
Common ancestry isn’t based on the function or lack of function in human orphan genes, so I am not sure what you are on about. If you think a lack of sequence conservation between species in human orphan genes, and even lack of sequence conservation within the human population for orphan genes, is not good evidence for lack of function then please explain why.