@Lynn_Munter
I think you are starting to invest too much time in micro-analyzing my every sentence. Your posts are now starting to look like Ben’s… where he rips into each and every sentence or two … counting the warrior’s coup against his opponent. I object to the approach out of hand. I will never attempt to respond to all those paragraphs you have laid out. I have no plan to even read all of that.
But as a demonstration of sincerity I will respond to your first … and with considerably robust discussion! I quote your response (above) to my discussion of the biological propensity for a population to create a Ring Species.
You seem most skeptical that there is much to think about. But let me give you an example of what I mean by using the Wiki illustration for the Larus Gulls:
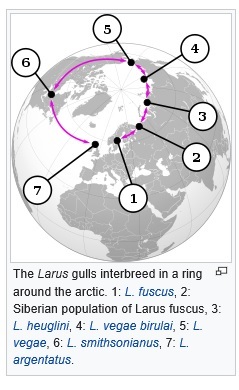
Let’s accept the premise that there are 7 distinct “pockets” of gull populations. And because of the progressive nature of geographical distances, acting as impediments to a free exchange of genetic factors between pockets, we might be able to calculate some kind of “Index of Difference” between the gene pool of sub-groups (2) and (4) and between sub-groups (2) and (6).
As the distance between sub-groups increases, the Index of Difference (however it might be calculated) should also increase… but only in reference to the gradient as defined by “Norway heading East” vs. “Britain heading West”, right?
In the polar map image, sub-group (7) is pretty darn close to sub-group (1), and even sub-group (6) isn’t too terribly far from (1) - - when compared to how far (6) is from (2) going in the opposite direction.
But historical developments do have their consequences. And the spread of the population appears to have anchored itself in Scandinavia, and extended itself further and further East. I’m sure there is an interesting story behind that progression.
The whole point of the diagram is to show how geography has influenced the growing genetic differences between sub-group (1) and sub-group (6) and/or (7). A comparison on these sub-groups should produce the highest mathematical calculation of “Index of [Genetic] Differences”.
But let’s ask some hypothetical questions: What if there was an affordable way to install feeding stations in key areas of the Arctic Polar region? Feeding stations that would attract members of some of these sub-groups? And what if we could control how many birds we could attract by carefully calibrating proximity of the feeding stations to the various concentration of population members, and by how much food was deposited at the various stations.
TEST QUESTION: What percentage of a sub-group would have to be enlisted, and how many sub-groups (and even what specific sequence of sub-groups) in order to introduce the genetic information of the “Westerly” populations in sufficient volumes into the “Easterly” populations to stabilize the genetic trend towards increased genetic differences to virtually ZERO?
The process would be analogous to installing “air pipes” of various diameters from one sub-group to another … allowing a set percentage of one group to begin exchanging genetic variance with a group that it ordinarily never mated with. At what percentages would the exchange even be noticeable? And at what percentages would the exchange be sufficient to prevent any further mathematical differentiation… but not to reverse the process?
And then, what percentage would be required to reach the tipping point of genetic exchange… where we could forecast than in 400 years, or a 1000 years, that groups (7) and (1) could once again mate and produce offspring? Finally, what percentages would have to be in play where all significant differences in “Reproductive Compatibility” were eliminated? … where (7) and (1) - - though they may look a little different - - essentially displayed the very same level of compatibility as groups (2) and (3), or (3) and (4), and so on?
So here’s the structure for the above questions to be asked. But this is just a prelude. The two serious questions to be answered by all this time and money invested is:
A) What genetic sites most closely affect “Reproductive Compatibility”? What process, or protein, or other elements prevents two individuals that look the same from producing fertile offspring? And what are the elements that allow 2 individuals that look different to still produce fertile offspring?
B) Having all this bounty of mathematical detail, we could certainly create an “Index of Propensity” (I would call it the Munter Index!).
^^^ The Munter Index <<<< !!!
.
.
It would be the mathematical measurement of the tendency for a population, divided into “n” groups, to create terminal populations that cannot produce fertile offspring! This would be quite an accomplishment!
But wait, there’s more! (I’ll be selling apple peelers in my next thread!.)
If we discover the answers to Question (A), and create a benchmark using the Gulls (or some other convenient animal group), we would then be able to apply the formula, using identical “Quantities n”, and forecast which groups (with their current genome) is least likely to create a Ring Species, and which groups are most likely to create a Ring Species!
Needless to say, there would be considerable standard deviations to cope with… and it would probably take an awful lot of sampling to get anywhere near a helpful measurement. But theoretically it would be possible. And it would demonstrate what I think many professionals would believe is the very heart of Evolutionary science:
. . . . what does it take to effect changes in Reproductive Compatibility, and what are the time frames for the process?
We would have the mathematical explanation for why some populations (like Lions and Tigers) seem to look very different, but still have some rudimentary Reproductive Compatibilities. The ultimate reason for Lions and Tigers looking so different is that the originators of their respective populations headed into different ecological niches.
Tigers headed into the tropical areas of India. Lions headed into the savannah regions of Africa. And the combination of Drift and Selection produced stripes on tigers and social living on Lions. But all this was not enough to break their Reproductive Compatibility. We call them two different species for practical reasons … or out of courtesy to our elders. But it seems clear that Lions and Tigers, together, would not qualify as a Ring Species. They just “get on” way too well!
While other populations of other creatures might look much more alike … they have stopped being able to breed with members of the other group many eons ago. And today, we still cannot answer exactly why.
In recent months, we have had at least 2 YEC-like participants insist that Speciation was not real, and that even it was, it would not lead to dramatic differences in animals (like Bears vs. Lions). But once we crack the math on Reproductive Compatibility, I think objections like those will become a dead thing from the past.
