Or perhaps we disagree on the reason for any reduction.
Do you care to elaborate on why the 4 studies I cited were, in your opinion, improperly conducted?
Peace,
Chris
I did not say or imply the studies were improperly conducted.
Perhaps you have my posts confused with those of someone else.
I did review the study you posted about mask usage in Georgia, and I noted that it did not support the level of change in mask wearing that supports the decline of hospitalizations (in my opinion). I don’t know why you think it does, as the mask use is Georgia has been consistent since July 27 and hospitalizations have continued to decline during the period.
The reasoning is simple:
- Improved mask adherence starting in mid to late July brought the R-nought substantially below 1.0. Continued mask adherence has kept the R-nought substantially below 1.0.
- Maintaining R-nought substantially below 1.0 has resulted in a continuous decline in cases.
- A continuous decline in cases has resulted in a continuous decline in hospitalizations.
Peace,
Chris
And how did you rule out attributing the reduction in R-nought to more people being immune, having already had the disease?
Since July 27, there have been another 120,000 cases confirmed in Georgia. Using the midpoint (15) of the CDC’s multiplier (6-24) for infections vs. confirmed cases, that means an increase of 1.8 million people who won’t get the disease in Georgia now that could have gotten it July 27. Shouldn’t that reduction in possible new infections reduce R-nought?
Georgia’s population is 10.6 million.
Maybe it is only a million rather than 1.8 million, but fewer in the population susceptible to the disease should mean fewer cases and a reduction in hospitalizations.
The period of interest on the graph is July 11 (peak in hospitalization rate) to August 29 (latest figures). The question posed by the graph is: What caused the decline in hospitalizations over this period?
In your last post, you compare the immune census on August 29 (you estimate 1.8M) to the immune census on February 29 (effectively 0). This does not seem to be the relevant comparison to the question being discussed, given that the decline in hospitalizations under discussion started in July.
The relevant comparison would seem to be: what was the immune census as of early July vs. what was the immune census in mid-July when the rapid decline started?
Does that make sense?
Peace,
Chris
Whatever the dates, my question remains: How did you rule out increased incidence of immunity as a cause for the decrease in hospitalizations?
I can’t help but think you are intentionally avoiding the question.
I don’t see how you can deny that R-nought will decline as more people become immune.
To look at boundary conditions, how many people could a sick person infect in the two situations:
- 1% of the population is immune
- 99% of the population is immune?
Isn’t the difference substantial?
Also, if I recall your link on mask usage properly, there was no change in estimated mask usage in Georgia until the 7/27 survey, indicating better mask adherence is not the cause of the reduction in hospitalizations in July. Georgia on your link had mask usage 40-49% from May 4 until July 27.
The major problem with your reasoning is that you haven’t come to grasp with the implications of the dates.
They are irrelevant to the situation in July because it was not the case that 1% of the population was immune on July 10.
You leap to this conclusion because you do not yet understand the implications of the selected date range. So I will walk you through it yet again.
The immune census is equal to the confirmed cases multiplied by some multiplier of the ratio of total infections (diagnosed + undiagnosed) to confirmed (diagnosed). For the sake of discussion, let’s assume that the multiplier is the geometric mean of the lower and upper bounds estimated by the CDC (i.e., geometric mean of [6, 24] = 12).
Now let’s examine the historical data 2 ways. One key question is: what is the chronological inflection point in COVID spread? To get an answer, let’s look at the daily confirmed cases data from the Georgia Department of Public Health:
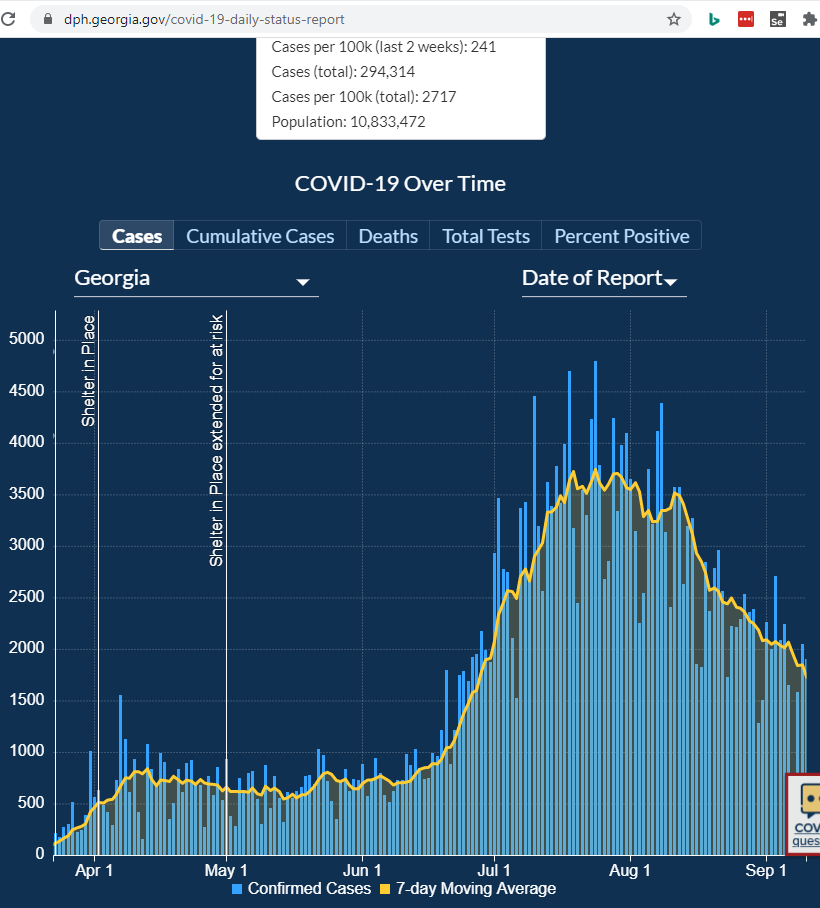
The occurrence rate starts dropping in early August. Assuming a 10-day lag between infection and case confirmation, that points to an inflection in the vicinity of July 20.
Note that this is very much consistent with the biweekly mask adherence data, which shows an increase from July 13 to July 27.
Now let’s look at the cumulative cases so we can get a rough estimate of the immune census on July 15 vs. July 30, the period over which the spread decelerates and then starts declining:
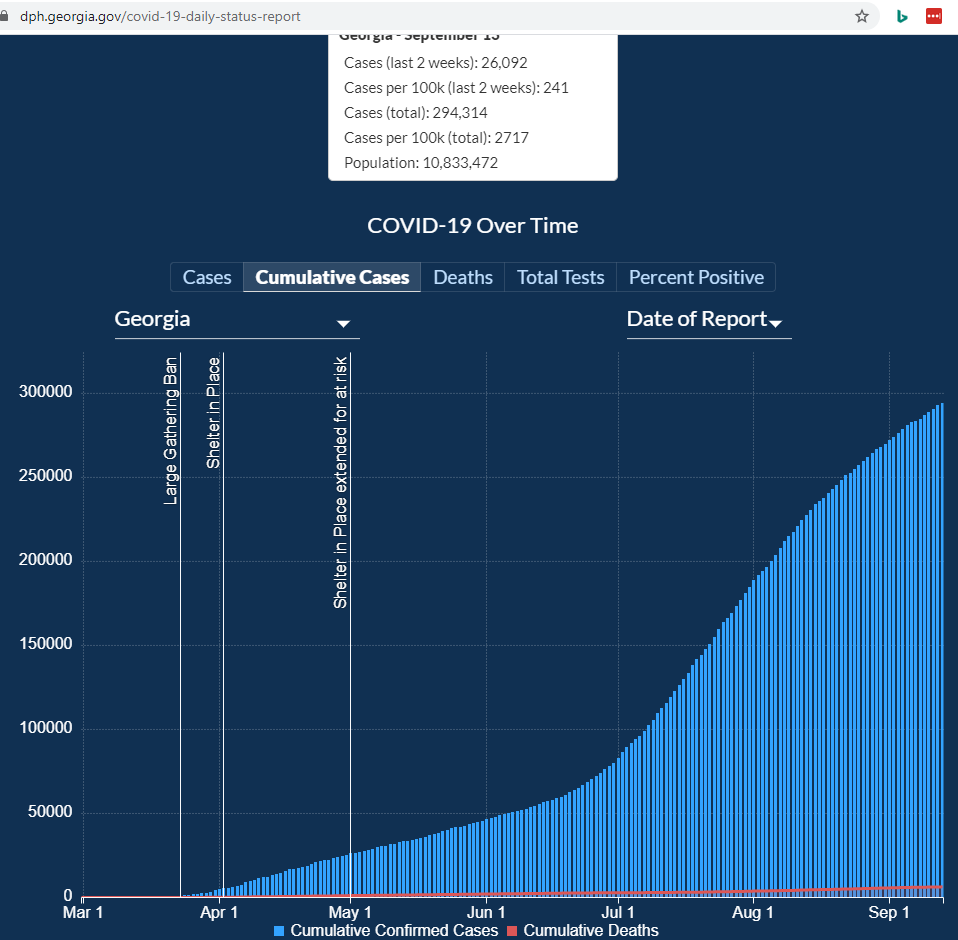
Because exact date counts use ecma-script, I cannot capture them with a screenshot. However, by visiting the site yourself you can confirm that cumulative cases as of July 15 were 126,380 and as of July 30 were 180,924. Multiplying by 12 yields actual immune census counts of 1.52M and 2.17M, respectively.
So herd immunity is achieved when the reproduction number (R-nought) drops below 1.0. In the absence of any other considerations such as masks and social distancing, this occurs when the immune census reaches ~70% under a homogeneous mixing model (https://arxiv.org/pdf/2004.11677.pdf), or 71% of that rate (i.e., herd immunity at 50%) under a heterogeneous mixing model (https://science.sciencemag.org/content/369/6505/846.full).
Given an estimate of actual immunity at 20% in late July arrived at above, one must therefore attribute primary causality for the drop to increased mask usage from early to late July. This is not to say that the removed population (in a SIR or SEIR model) was of no significance; my claim is simply that the dominant factor in the sharp inflection was increased mask adherence during the relevant period.
Peace,
Chris
Chris, thank you for the post. Only two things seem to be missing.
Doesn’t the incidence of immunity in a population affect R-nought?
Your post seems to say that, but it is not as clearly stated as it should be given that I have asked you that question several times.
For the second thing missing: your analysis seems to lump the the “out and about” population interacting with others with the isolated population. It seems much more reasonable to note that some are sheltering in place as much as practical while others are out and about everyday. The population encountered by infected people as they go about their lives are therefore more likely to interact with others who have been infected already — as those who previously contracted the disease did so in part because of their greater tendency to interact.
So the 25+ percent of the population that is immune constitutes a greater percentage of those coming in contact with infected people. This should affect R-nought.
By the way, I understand geometric mean has its use in growth rates, but I question its use in this case.
Oh, and boundary analysis is a valuable tool for testing the reasonableness of concepts, such as whether the incidence of immunity in a population affects R-nought.
Watch the numbers. They will go up again.
Dale, do you have a prediction of which numbers will go up and when they will go up?
Are you writing about hospitalizations?
Testing positive, hospitalizations and deaths, including more children. And fairly soon, within months. I will be glad to be wrong.
Thanks for the answer, Dale.
Of course deaths will increase, hospitalizations will increase, and confirmed cases will increase. Every new death, hospitalization, and confirmed case adds to the increase. This will happen everyday.
There is nothing to disagree with there.
But your presumed herd immunity is bogus before a vaccine. I would be glad to be wrong there, too.
I expect rates to go up, not just, of course, duh, totals.
It does.
In the absence of a vaccine, the removed population consists of those who are immune by virtue of having recovered from illness.
I have already referred to this by using epidemiology terminology (“heterogeneous mixing”).
Peace,
Chris
1 Like
Are you aware that it is a somewhat cryptic admission?
About 1.1% of detected cases in the 20-24 year old group in FL ended up hospitalized. Source (warning takes some time to load): https://public.tableau.com/shared/87CYDHBM5?:display_count=y&:origin=viz_share_link
1 Like
My working assumption was that anyone interested in discussing epidemiology models and their implications would understand the relevant terminology.
Peace,
Chris
Well, that certainly limits the audience of the valuable information you have to provide.
Have you considered broadening the potential recipients of your wisdom?
I wonder how many of their compadres were asymptomatic or mildly asymptomatic.