I don’t buy it. An increase in O2 concentration to 35% will cause minimal change in bariometric pressure (though a significant increase in the partial pressure of oxygen, which is a totally different thing, and which I wonder if the writer of the article got confused about).
But, that is all totally irrelevant. We are talking about carbon dating, so the only thing that matters is the last 50,000 or so years, and you are referring to possible conditions millions of years ago. They have no bearing on carbon dating at all.
My subject has never emphasized carbon dating, but concerns radiometric dating. Although carbon dating does fall under the category “radiometric dating” I’ve had the entire Phanerozoic in mind. The Carboniferous to me is symbolic of the types of conditions that we are dealing with that cause the dating flaws. ie radiometric decay of long life isotopes have not yet been been measured under huge lengths of time in conditions that have dramatically lowered muon flux. As someone posted earlier, ratios of parent/daughter isotopes are measured over 19 years to establish decay rates of long life isotopes. My problem is that this has not been done under Carboniferous conditions, so it’s possible parent isotopes decayed a lot faster then, having less muon interference.
I didn’t just quote from one article , but two articles on the subject of higher air pressures in the Carboniferous. Just google Pterodactyls flight, and you will see in the Triassic/Jurassic the air was far denser than today, enabling pterodactyls to fly.
Were you there?![]()
While a lot of things can be artificially produced in the lab, there is no evidence the lab conditions were reproduced in nature. If indeed hundreds of layers started appearing every year, the graph would show divergence of the carbon decay from the layer lines, which it does not. Also, precipitation events take time, and there is just not enough time in a year to produce the effect you want to see. Not to mention that these events would have to be consistent globally to correlate with each other.
I admit, this type of discussion is frustrating, as you appear to recite the same mantra over and again, but in a strange way is helpful, as it forces me to look at the errors in your reasoning and re-examine the evidence in light of your comments. Thank you for reinforcing my understanding of the science and confirming my views on the matter. Iron sharpens iron.
3 Likes
Of course I wasn’t there, but I am applying studies to the evidence. Studies that show that more than one tree ring annually is more common than just one annual ring. Studies that show that an annual varve normally involves multiple distinct layers inside it, a virtually impossible situation for the so-called 1mm annual varves of Lake Suigetsu. Even deductive reasoning is clear that in a minor catchment area each rainfall will reflect as a layer in that lake.
You say precipitation events take time, I’m not sure what you mean, when it rains, this drains via a river into the lake and forms a sediment layer. A number of these form every year, not one.
If I am reading it correctly, it is a question of where the muons are made. Since muons have a half life of a few microseconds it matters where they originate from. If they originate way up in the atmosphere then they decay before they can get to the detectors. However, if they originate lower in the atmosphere then they can hit the detectors before they decay.
1 Like
Hum. What I read says “occasionally” rather than more often and occasionally they also skip a ring. and the extra ring is caused by drought stress. Kind of tough to get multiple drought stresses and multiple precipitation events in the same year.
"Occasionally, trees will produce more than one ring in a year. The extra ring is called a false ring and it can be the result of drought stress in the middle of a growing season. Other times a tree can go a year without producing a ring. This can happen when the tree is suffering from severe stress like being burned in a fire, attacked by insects, or adverse weather conditions. When you crossdate you use a tree that doesn’t have a missing ring to find where other trees do have missing rings. "
https://www.fs.fed.us/rm/highelevationwhitepines/Education/science-inquire.htm
3 Likes
This is controlled by using tree ring data from separate forests on separate continents, such as the bristlecone pine data from North America and the German oak data sets. They agree with each other.
That isn’t the case. The calibration curve is based on multiple sources from all over the globe. It includes speleothems, lake varves, tree rings, and ice layers, to name just a few. Again, what you need to explain is how completely different processes can all produce the same results.
The layers are not different types of clay. They include diatoms which bloom in the warm months. You also need to explain how this process is able to sort dead leaves and insects by their 14C content if it isn’t an annual process. You also need to explain how lake varves can sort insects and leaves in such way that it matches the carbon isotope make up of tree rings from multiple contents and speleothems from different continents.
5 Likes
Yes, and they can penetrate rock, deep into the surface. And be detected there too. Due to muons being the main source of surface background radiation, during the Carboniferous, early Permian, Triassic, Jurassic when air density was higher, it is highly likely that radiation from solar/cosmic sources was greatly reduced.
If there’s a possible current effect that decay fluctuates slightly when exposed to slight changes in background radiation, how much more so when muons do not even reach the surface? That’s some exciting possibilities there in the study of radiometric decay.
You still haven’t linked this to any flaw in radiometric dating.
Until you come up with evidence for muons significantly influencing the decay of isotopes used for radiometric dating you really don’t have an argument against the various methods.
2 Likes
Even if one accepts that as significant, which I see no reason to do so, it still does not relate to carbon dating in varves as they are far younger and we are not looking much beyond 50 kya with that.
1 Like
Someone may have already linked to this study, but just in case:
2 Likes
On the contrary, the ONLY reason the constancy of decay rates is assumed, is because it is claimed that decay has been subjected to various tests and NOTHING realistic can affect them.
If you cannot show me actual studies that indicate that decay has been tested with a complete block out of background radiation including muons, then the constancy of decay rates remains completely in doubt.
It isn’t assumed. The constancy of decay rates is measured.
Until you demonstrate how muons would affect the decay rates, your argument has no merit.
2 Likes
You’re forgetting the fundamental rules of Young Earth Science:
- Any measurement that contradicts a young earth is, by definition, an assumption.
- Any test of assumptions in the measurement of evidence that contradicts a young earth is, by definition, also an assumption.
It’s their magic shibboleth. A word that they believe automatically dismisses any and every line of evidence that they don’t like. Basically, YEC-ese for “I’m not listening.”
2 Likes
You seem to doubt what I say. So I will show you some comments from scientists: CAN ENVIRONMENTAL FACTORS AFFECT HALF-LIFE IN Beta-Decay? AN ANALYSIS
A Dissertation by JOHN RANDALL GOODWIN
Early in the history of the field of nuclear science, experiments were performed to
ascertain whether the half-lives of the radioactive substances being studied - isotopes
then called the “radium emanation” [222Rn], “radium A” [218Po], “radium B” [214Pb],
and “radium C” [214Bi] - were dependent upon any external factors. At that time, the
external factors deemed most likely to affect half-life were temperature and pressure.
After several experiments, designed to pick up any change in half-life in the course
> of changing temperature or pressure, had failed to find any significant changes, it
> was concluded that half-life does not depend on the physical properties of external
> environment.
Hopefully you can see that the only reason that decay rates are regarded as constants, is due to being tested for influencing factors. Muons were not one of those tests. They left something out. Simple. So the conclusion that half life does not depend on the physical properties of external environment, is no longer conclusive as it seemed to be.
By your own admission, muons have been tested. They vary by season, and they can also vary by proximity to the sun. Guess what? Decay rates don’t vary during that time.
Until you come up with any evidence demonstrating how muons can influence decay rates you don’t have an argument. You might as well reject the constancy of decay rates because they didn’t consider the eye color of the scientists doing the measurements. If you want to claim that something influences decay rates then it is your burden of proof to demonstrate that influence. It isn’t up to us to rule out something that has no evidence supporting it.
5 Likes
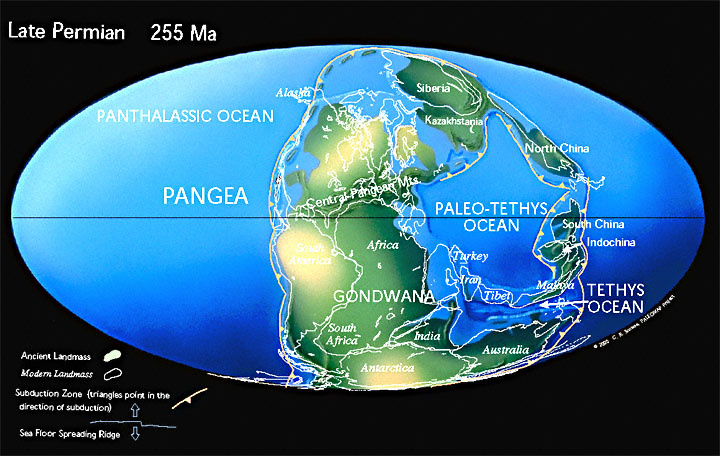
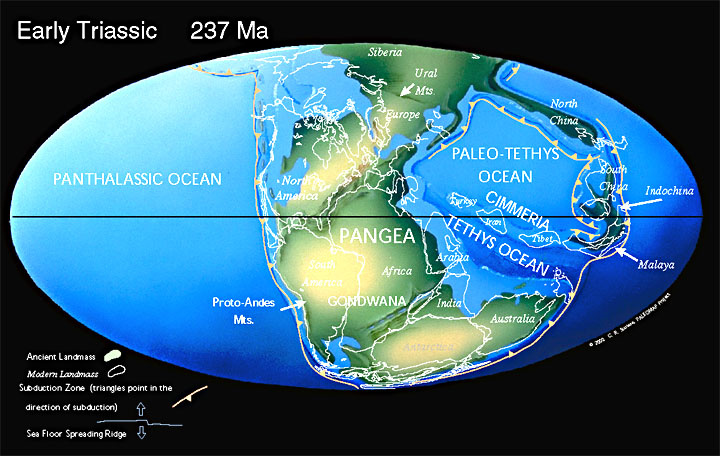
I don’t know what you are talking about saying that there was a major marine transgression. Most of the Permo-Triassic rocks are continental, and a large chunk of them are desert deposits because North America slammed into Eurasia and caused the Appalachian mountains to rise which produced a rain shadow behind those mountains on the North American continent. From Scotese.com here are pictures of what was above water during the Permian and Triassic. Not much was below water.
The Permo Triassic was dominated by red-beds, oxidized sediments of terrestrial origin and evaporitic minerals. while there might be local transgressions there is no major global transgression here. Marine beds tend to be darker than continental beds because marine beds better preserve organic matter.
Permian Triassic Caspian depression has red beds ~ Derek
Ager Geology of Europe, (New York: John Wiley and Sons,
1980), p. 57.
“Permian rocks of the W. Colorado Plateau contain 5
evaporite units that are separated by one marine sandstone
and 4 limestones in a cyclic relationship.” ~ R. L.
Nelson, “Permian Evaporites, Western Colorado Plateau,
Southwestern Utah and Northwestern Arizona.” AAPG BULLETIN,
66:5, (May, 1982), p. 2108.
“Of the four formations in the Supai Group, only the
uppermost- the Esplanade Sandstone - contain evaporite
deposits in the Grand Canyon region. These deposits
consist of beds of gypsum and gypsiferous sandstone in the
upper part of the formation.” ~ Edwin D. Mckee, The Supai
Group of Grand Canyon, USGS Professional Paper 1173,
(Washington: U.S. Gov’t Printing Office, 1982), p. 377.
Permian red beds Peruvian coast
"Continental red beds (Mitu Formation), with abundant
pyroclastic material originated in volcanic centers located
along this belt, were accumulated in the central Cordillera
of Peru between Leimebanba and Lake Titicaca. In the Tarma
region the red beds contain thin marine intercalations. . .
" ~ H. J. Harrington, “Paleogeographic Development of
South America”, AAPG BULLETIN, 46:10, (October, 1962), p.
1791.
“The Rio do Rasto red beds are chiefly sandstones which
include some siltite shale and conglomerate beds. They are
present in Parana and in Santa Catarina resting on the
Estrada Nova group.” ~ Avelina Ignacio de Oliveira,
“Brazil”, in William F. Jenks, editor, Handbook of South
American Geology, (New York: Geological Society of America,
1956), p. 37.
“The Permian sequence of the Pampean Ranges of northern La
Rioja consists of 1,500 m. of typical "red beds.” ~
Horacio J. Harrington, “Argentina”, in William F. Jenks,
editor, Handbook of South American Geology, (New York:
Geological Society of America, 1956), p. 139.
Permian salt: "In northwestern Germany the salt deposits swell to a
thickness of nearly 1,000 m. ~ Roland Brinkmann, The Geological
Evolution of Europe, translated by John E. Sanders, (New
York: Hafner Publishing Co., 1960), p. 65.
gypsum anhydrite red beds and limestone predominate on the
Russian Platform Table 12 ~ D. V. Nalivkin, Geology of
the U. S. S. R., translated by N. Rast, (Toronto:
University of Toronto Press, 1973), p. 100
“The Permian deposits of the northern hemisphere show
numerous indications of a warm, even hot, and increasingly
arid climate. The Rotliegend facies with its arkoses and
fanglomerates must have originated under semi-arid
conditions. Owing to its thick rock salt and potash-salt
deposits the Permian was the most important time for salt-
formation in the geologic past.” ~ Roland Brinkmann, The
Geological Evolution of Europe, translated by John E.
Sanders, (New York: Hafner Publishing Co., 1960), p. 65.
“In the North Ustyurt basin, the most complete Permian-
Triassic sequence (3,000 m.) is penetrated on the northern
slope of the North Buzachi uplift. Most of the sandstones,
siltstones, shales and tuff argillites, with rare interbeds
of limestone. Coarse-grained rocks predominate in the
upper part of the sequence while the most widespread rocks
in the lower part are shales. The age of the redbeds is
unknown, but they are thought to belong to the Olenek Stage
or to correspond to all stages of the Early and Middle
Triassic. . . . Non-marine sedimentary and volcanic rocks
occur above the red beds. The areal extent of these rocks
is unknown.” ~ G. Ulmishek and W. Harrison, Petroleum
Geology and Resource Assessment of the Middle Caspian
Basin, USSR, with Special Emphasis on the Uzen Field,
ANL/ES-116, (Argonne, Illinois: Argonne National
Laboratory, 1981), p. 38.
"In the following section, the distribution, depositional
environment and facies of the major red bed occurrences
will be reviewed. Their regional distribution is so vast
that many minor areas will be omitted, and even for those
that are considered, only a general account will be given."
~ B. Waugh, “The Distribution and Formation of Permian-
Triassic Red Beds”, in The Permian and Triassic Systems and
their Mutual Boundary, Canadian Society of Petroleum
Geology Memoir 2, p. 679.
“Origin of the red color of many sedimentary rocks has been
a subject of controversy for generations. Red beds are the
trademark of Permian and Triassic strata on five
continents” ~ Robert H. Dott, Jr. and Roger L. Batten, The
Evolution of the Earth, (St. Louis: McGraw-Hill Book Co.,
1981), p. 335.
The Keuper is a formation in Europe of Triassic age
“Very well, but then let us go right down to the south-west
corner of the United States and look at the Moenkopi and
associated formations of Arizona. The glorious colours of
the Painted Desert are produced by the same sort of red and
green ‘marls’ as we have in our Keuper.” ~ Derek Ager, The
Nature of the Stratigraphical Record, (New York: John Wiley
and Sons, Inc., 1981), p. 6
“The Triassic is recorded on all continents, mostly as
terrestrial or lacustrine sediments. The name "new Red
Sandstone" expresses this fact. As might be expected, the
‘Old Red Sandstone’ marks another conspicuous regression
maximum straddling the Siluro-Devonian.” ~ S. Warren
Carey, The Expanding Earth, (New York: Elsevier Scientific
Publishing Co., 1976), p. 122.
I have read and used to own all these books above. [content edited by moderator] I spent 46 years doing geoscience, [content removed]
100 years ago they didn’t even know about muons, so it is not surprising that they did not perform those tests.
However, in the past few decades, considerable work has been done on this very question. And the verdict is: fluctuations in muons have no effect on the rate of radioactive decay.
I remind you of the study cited by @T_aquaticus:
Evidence against solar influence on nuclear decay constants
The hypothesis that proximity to the Sun causes variation of decay constants at permille level has been tested and disproved. Repeated activity measurements of mono-radionuclide sources were performed over periods from 200 days up to four decades at 14 laboratories across the globe. Residuals from the exponential nuclear decay curves were inspected for annual oscillations. Systematic deviations from a purely exponential decay curve differ from one data set to another and are attributable to instabilities in the instrumentation and measurement conditions. The most stable activity measurements of alpha, beta-minus, electron capture, and beta-plus decaying sources set an upper limit of 0.0006% to 0.008% to the amplitude of annual oscillations in the decay rate. Oscillations in phase with Earth’s orbital distance to the Sun could not be observed within a 10−6 to 10−5 range of precision. There are also no apparent modulations over periods of weeks or months. Consequently, there is no indication of a natural impediment against sub-permille accuracy in half-life determinations, renormalisation of activity to a distant reference date, application of nuclear dating for archaeology, geo- and cosmochronology, nor in establishing the SI unit becquerel and seeking international equivalence of activity standards.
[emphasis mine]
You have not yet addressed this finding. Why not?
Best,
Chris Falter
1 Like
Let’s try this again. The accuracy of carbon dating is not dependent on a “few tree rings.” Do you know what goes in to rigorous study in the field of dendrochronology? There seems to be a fundamental gap between how science is actually done and how you think it is done.
Do they though? They are the organization that would probably agree with the founders of the modern YEC organization who wrote things like:
- “The instructed Christian knows that the evidences for full divine inspiration of Scripture are far weightier than the evidences for any fact of science”
- “We take this revealed framework of history as our basic datum, and then try to see how all the pertinent data can be understood in this context”
Or they say for example about the Big Bang theory: from the Bible we can already know that the Big Bang theory is wrong.
In other words, the foundations of young earth creationism are not to actually test hypotheses, but it’s to start with a conclusion and then fit everything into that mold. And what they then do is project that onto actual scientists, despite the fact that varves don’t actually matter in the big picture of anything for scientists. They are useful, sure. But if we had no varve chronologies then that wouldn’t change anything about any field of science. However, varve chronologies by themselves refute the entire young earth creationist movement. So I’m sure that this article you linked will be a wonderfully well done refutation of varves. In other words what I expect is a list of arguments that try to cast doubt on the conclusions from real scientific publications and then proclaim they’re still right at the end of the day without actually explaining the evidence.
Looking at the article you sent
Hey they mention @gbob in the introduction! Nice shout out there.
Everytime they make a dishonest statement I’m going to post it here, starting with the Background Information section.
- They write: Because varves are by definition “annual,” they have been used to measure the ages of lake deposits and as proof of ages of millions of years.
- But… you can’t use varves to construct a chronology of “millions of years.” The oldest sequence is the Lake Suigetsu sequence and that might go back to 150,000 or so but the chronology is only worked out to about 50,000. Why do they even write such nonsensical statements?
- They cite a few papers demonstrating that multiple varve sequences can form in a single year. For example, we have a 1979 paper from Lambert & Hsu.
- Yes, that’s why Lake Suigetsu is so important. Because when we’ve run the checks for false layers, the evidence withstood the scrutiny!!! The same is true for Lake Steel varves, but they only go back approximately 5kya.
- Then they write: It appears then, that claiming a varve is an annual event is an assumption in itself; one steeped in uniformitarian thought, but not reality.
- That is a LIE. Straight up they are lying to you. Sorry @Mindspawn. The papers they cite literally refute this statement because they demonstrate that scientists don’t just assume that a varve is an annual event. They actually, well you know measure stuff.
Phew, made it to the Can Many Thin Layers Form in a Short Amount of Time?
- I have no idea what the paragraph about Berthault is all about since I’m not a geologist. This looks like a wonderful summary: http://www.theotokos.org.uk/pages/creation/berthaul/henke.html
- Next there’s a discussion of the formation of various deposits from Mount St. Helens.
- I have to keep going but really, Mount St. Helens, even if true, is a volcano. If it actually formed varves within hours, it would have to have sorted the varves by alternating layers of organic and nonorganic sediment AND sorted them by less C-14 in layers that are further down AND deposited layers of ash in between such that when you Potassium Argon date them, you get the SAME NUMBER as counting the varves above. This is just ridiculous. Volcanoes don’t do anything like that and this section is a giant smokescreen that has nothing to do with Lake Suigetsu.
Let’s just skip the rest of this section.
I’m just scrolling down. There are many other just absurd statements… like:
- With the exception of perhaps a few bristlecone pines, none of these maximum possible tree ages are anywhere near 4000 years in age. This means that the numbers on the horizontal axis of Davidson and Wolgemuth’s (and our) Fig. 5 could not have been obtained merely by counting tree-rings in individual trees.
- That is rather silly. That’s not how dendrochronology is done where you have one super old tree and then you just use this to figure out the entire chronology.
Alright I can’t make it anymore. But let’s go with this graph from the AiG article:
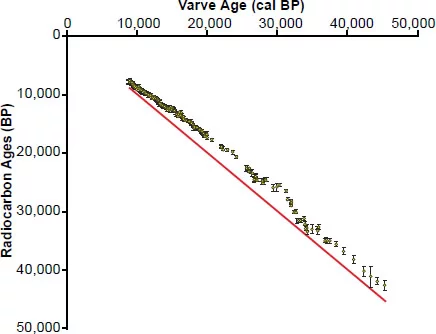
They proclaim that the radiocarbon ages almost never agree with their respective varve ages, apparently also not understanding or just lying about what this graph actually tells us. They have no explanation for it, and that’s the point. They just hand wave everything away, make all kinds of distracting statements, and then fool well meaning Christians like yourself that they are doing actual science.
6 Likes
Nice, thanks for all that info.
Obviously the Permian map refers to the standard coastlines towards the end Permian.
I’m specifically referring to the raised sea levels that occurred during the major marine transgression of the end Permian. More specifically i’m trying to determine the extent to which the marine transgression flooded continental interiors and the height of the Appalachians at that stage.
The firmground marked a rapid transgression at the very end of the Late Permian and significant shifts of sedimentary environment and paleoclimate. This transgressive submerging surface is also observed at the Huangzhishan section of the shallow-water carbonate platform facies in Zhejiang Province, the Jiangya section of the lower-slope to basinal-margin facies in Hunan Province, the Pingdingshan section of the basinal facies in Anhui Province of South China, as well as the Selong section in Tibet of the northern peri-Gondwana. The transgressive submerging surface marks the onset of a rapid global transgression at the latest Permian.
Blockquote
http://archives.datapages.com/data/cspg_sp/data/017/017001/813_cspgsp0170813.htm
During the Lopingian Epoch marine faunas were well developed in limited shelf seas of the Paleotethys, but suffered no dramatic change. The collapse of marine ecosystems at the end of the Lopingian was most likely triggered by a sudden and widespread flooding over all relict shelves, following maximum emergence of epicontinental seas around Pangea.