ERV evidence for pastor with a lawyer's mind

Here is another analogy geared towards christians for you to ponder:

When scientists say that a process is random what they are saying is the observable results are indistinguishable from a random process. Science doesn’t test metaphysical claims, but rather tests hypotheses. If there is purpose that appears to be random then science wouldn’t be able to detect it.

As an analogy, we could look to Jonah:

Jonah 1:7 Each man said to his mate, “Come, let us cast lots so we may learn on whose account this calamity has struck us.” So they cast lots and the lot fell on Jonah.

Most of the sailors on that ship would have seen what appeared to be a random occurrence, but was there purpose behind it?

1 Like

@Mazza_P

Your discussion of “random processes” will always be vulnerable to misinterpretation if you don’t include the usual disclaimer that God knows the difference between the “random appearance of some orderly things” and things that may satisfy the mathematic definition of randomness, but which are truly guided by his Will and Purpose.

1 Like

And Proverbs 16:33 says “The lot is cast into the lap, But its every decision is from the LORD.” So yes there is purpose behind every “random” event.

1 Like

That is even better than the verse I used. There appears to already be a tradition within Judeo-Christian theology that there is a deeper mystery underneath random events. Therefore, things like random mutations or random retroviral insertions shouldn’t be a problem for the theological position where God works through natural processes, at least from what I can see.

4 Likes

Thanks. That is true, but I doubt that my chat with my pastor will go to that level. He isn’t really into maths. The reaction to “random” if he has one is probably more of an emotional one brought on by ID people discussing it as if it means “aimless”. My tipping water over my head example is a bit of fun, but one that he will probably appreciate! Just so long as he doesn’t feel the need to have it as a sermon illustration with me as the victim!

In previous posts I discussed the position of ERVs in genomes, and how they evidence common ancestry between humans and other apes. Here is an excerpt from a 1999 peer reviewed paper by Johnson and Coffin:

“Given the size of vertebrate genomes (>1 × 10⁹ bp) and the random nature of retroviral integration (22, 23), multiple integrations (and subsequent fixation) of ERV loci at precisely the same location are highly unlikely (24). Therefore, an ERV locus shared by two or more species is descended from a single integration event and is proof that the species share a common ancestor into whose germ line the original integration took place (14).”
http://www.pnas.org/content/96/18/10254.full

As with all good science, it is always a good idea to test a theory from multiple independent lines of evidence. ERVs actually supply 3 different lines of independent evidence for common ancestry, one of which I discussed in previous posts. The next line of independent evidence is LTR divergence. From Johnson and Coffin (1999):

“Third, sequence divergence between the LTRs at the ends of a given provirus provides an important and unique source of phylogenetic information. The LTRs are created during reverse transcription to regenerate cis-acting elements required for integration and transcription. Because of the mechanism of reverse transcription, the two LTRs must be identical at the time of integration, even if they differed in the precursor provirus (Fig. 1A). Over time, they will diverge in sequence because of substitutions, insertions, and deletions acquired during cellular DNA replication.”

Here is a diagram of a retroviral genome:

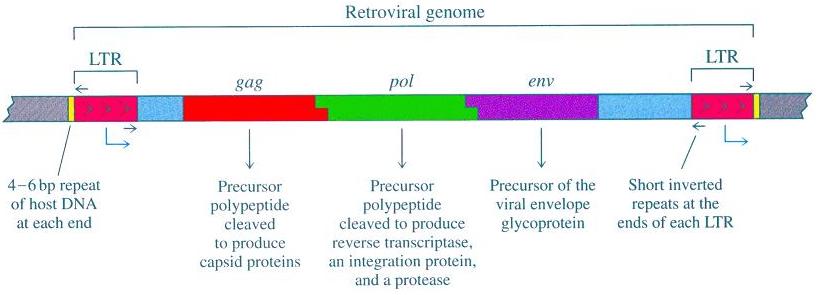
As you can see, the LTRs, or long terminal repeats, are like the bookends of the retroviral genome, called the 5’ and 3’ LTRs. As part of the retroviral life cycle, one LTR on one side is copied to produce the other LTR on the other side. Therefore, when the retrovirus inserts into the host genome the two bookends (the LTRs) have identical sequence. Once in the host genome, the slow accumulation of different mutations in each LTR will cause the LTRs to become less similar over time.

So how does this phenomenon allow us to test common ancestry? Evolution predicts that LTR sequences should reflect evolutionary distance, and that they should diverge from each other. That is, there should be more differences between the orangutan and human LTRs than between the chimp and human LTRS. If we use LTR sequences as inputs into phylogenetic algorithms then the phylogenies produced by these algorithms should match the phylogenies constructed by morphology (i.e. what the species look like). This is the standard phylogeny for apes:

From the Johnson and Coffin (1999) paper, this is the phylogeny of shared LTRs among different primate species:


(click on image for larger version)

As you can see, the standard phylogeny and the LTR phylogenies match for almost all nodes. On top of that, the 5’ and 3’ LTRs are on different branches of the phylogeny, consistent with the expected divergence. This is yet another independent line of evidence that screams common descent. Only evolution predicts a phylogeny of LTR sequences. ID/creationism does not.

4 Likes

Nice! I don’t understand every word, but I understand enough to see how good it is!

I’ve had two chats with my pastor now, and he has certainly taken some of the evidence on board. He also told someone else to look up Biologos!

He has asked me to prepare 6-10 weeks’ worth of material for a small group looking at resolving faith and science issues. He said he might come! That’ll be next year, so I might start a post then to see what ideas people have for what should go in the sessions. But I already have some good stuff now, so thanks everyone!

2 Likes

I always love to answer science related questions, so don’t be shy. I am always trying to improve how I present this info to the general public so your input would be very helpful. When you know the science in and out it can be difficult to judge how well you are getting across to people who don’t understand the science.

2 Likes

Someday I will find an application for phonetic science or the evolution of phonology in languages in an answer to some question posed on Biologos - then I’ll be the one trying to explain to the general public! But until then, I’m grateful for your efforts!

Hello and thank you for your post and links re ERVs.

I have a question about the charts; the chart in Nature you linked was from an article that did not allow me to read the article itself. But you did not reference the article but the chart. I found the chart ( 11) to be unintelligible without explanation. It certainly was not self explanatory.

The second chart was a bit more informative as it gave what appeared to be statistical comparisons. Also from Nature you linked “Table 2” titled “Tranposable element activity in human and Chimpanzee lineages” and then listed down the left side “Element” and began the left list with; Alu, LINE-1, SVA, ERV class 1, ERV class 2, (Micro) satellite.
Then, in column 2 and 3 was the comparison between Chimp and Human.
The footnote says "Number of lineage-specific insertions (with total size of sinserted sequences indicated…"
So “Alu” showed chimp with "2,340 (0.7 Mb) and the human comparison across from the chip was "7,082 (2.1Mb).

I won’t go through the six others on the left side list.
Would you please “translate” that Table 2 chart? Starting with Alu? And since this Table authenticates your description of the ERV comparison, please also help me understand why the list contains items other than ERV.

On the list, the fourth one down is “ERV class 1”…with Chimp at “234 (>1 Mb)” and Human at “5 (8 kb)”…
ERV class 2 is then listed with its comparisons.

Would you please explain the ERV comparisons and also explain the other non ERV items compared.

By the way, I understand how ERV works so I’m not needing a basic tutorial…I’m only needing help with the Table you linked which I outlined above.

Thank you so much for your help and patience.

Oh, and by the way…I’m a “lawyer with a pastor’s mind.”

That is unfortunate! The article should be open access IMO. I did find the full text available at Readcube, which is the source of the technology that Nature has been using for the last few years to allow non-subscribers to read papers online. The site is legit (i.e. it is allowed by the publisher). This link should get you the full text:
Initial sequencing and analysis of the human genome (2001 paper)

1 Like

I know your question is for @T_aquaticus but I thought I’d try to help here.

Overall: The table shows common transposable elements in human genomes. ERVs are a subset of these transposable elements. The title of the table is “Transposable element activity in…” The table authenticates the claims in the post by documenting the source of the numbers provided by @T_aquaticus regarding ERVs. His/her numbers come directly from the table: s/he wrote “When they sequenced the chimp genome they found that 82 of those human ERVs were not found at the same spot in the chimp genome” — 82 is the sum of the ERV numbers under “human” in the table.

Alu elements are extremely abundant transposable elements in primate genomes. They must be at the top of any list of transposable elements in humans.

Wonderful. I’m so interested in this subject so need lots of help. Thank you.

Thank you Stephen; I note the word “sum” was used which is an idea I can deal with! But where in the Table under human is the “sum” found? Are we at “ERV class 1”? Just go through the line with me and show me…sorry I’m so slow.

In the meantime, I’ll read the article if you don’t hear back from me for a while…thank you again.

The sum is 82, which is 77 and 5 added. That sum was computed by @T_aquaticus.

The table lists ERV class I, class II, and class III, which are the ERVs we are looking at. The heading on the first column is “Number of copies (x1000)” which translates to the number of insertions times one thousand. If you add up the number of insertions for class I-III you get 203,000 total ERV insertions. The other rows are other types of repetitive DNA. In the LTR group with ERVs are MaLRs which are transposons that have also picked up LTR sequence from ERVs.[quote=“senatorthomas, post:22, topic:36182”]
Would you please “translate” that Table 2 chart? Starting with Alu? And since this Table authenticates your description of the ERV comparison, please also help me understand why the list contains items other than ERV.
[/quote]

The table lumps ERVs and transposons together because they are repetitive sequences of DNA that insert themselves all over in the genome (i.e. transposable element activity). Transposons will jump out of the genome and then insert themselves somewhere else. ERVs are viral DNA with repetitive DNA that insert themselves into the genome. Geneticists use algorithms that look for repetitive DNA, so these algorithms will detect transposons, ERVs, and micro-satellite DNA which is why you will often see them on the same charts. You can read more about repetitive DNA at Wikipedia:

Alu and LINE-1 insertions are transposons. The stuff we are interested in is the retroviral insertions, which are listed in the ERV rows. The numbers in the chimp column are the insertions found in the chimp genome, but not in the same position in the human genome. The numbers in the human column are the insertions found in the human genome, but not in the same position in the chimp genome. This is why they are called “lineage specific”, because those insertions were produced after the chimp and human lineage split from their common ancestor. The XX Mb represents the number of DNA bases in these insertions (M = 1 million, 1 Mb is one million base pairs). When we compare both tables, what we see is that there are about 203,000 total ERVs in the human genome, and only 82 (77+5) of those human ERVs are found only in the human genome. The rest of the 203,000 human ERVs are found in the chimp genome at the same spot (i.e. orthologous).

Transposons can also be used as evidence in the same way that ERVs are used, but they are a bit harder to track due to much higher activity and other funky stuff that they like to do (e.g. higher recombination rates, excision). ERVs are a bit more straightforward.

1 Like

Welcome! Nice to see that you made it over here to our crazy little corner of the interwebs.

Hi Mary,

The laws governing the universe are composed of stochastic processes (see def. below). So, consider chemotherapy.

The success of chemotherapy is dependent on the random outcome of millions of individual drug interactions. If the great majority of those outcomes are positive, the chemotherapy is likely to succeed. On the other hand, the failure of even one of those interactions may result in a reoccurrence. So, even though a particular chemotherapy protocol is based on random interactions, the chemotherapy is not without purpose.

But wait, there’s more. There’s actually a great biblical example. In Genesis 1:11-12, God delegates the creation of fruit trees to nature. But, in the delegation God describes the kind of fruit tree He wants nature to produce: God wants nature to produce “trees bearing fruit making fruit”. But in the next verse, nature - composed of stochastic processes - is only able to produce “trees making fruit”. So, God wanted fruit trees making fruit, and nature was only able to give Him trees making fruit. But, evidently God was satisfied with His fruit trees and pronounced it all good.

More simply put, the creationists you read or listened to, do not understand the workings of randomness in evolution.

Blessings,

Michael

sto·chas·tic
stəˈkastik/Submit
adjective
randomly determined; having a random probability distribution or pattern that may be analyzed statistically but may not be predicted precisely.