Conditions at the bottom of the Mediterranean
One of the reasons I go down so many different trails is that objections to geologic theories can come from so many different directions, meteorology, paleontological, physics, basin modeling, sedimentology, geochemistry, economics, drilling, production etc. To be a successful oil finder means one has to have a working knowledge of all these areas because when you sell an oil deal, you never know what kind of question you will be asked about your prospect. Forty seven years of finding oil brought me a lot of contact with these and other issues.
This post will be a bit more difficult for most as it does get into how the atmospheric temperature works. I am sorry about that but it must be covered.
Thus, for the past two weeks, I have been investigating an atmospheric model for the Mediterranean. One will wonder of my qualifications for this, but my first aricle in the Creation Research Society Quarterly was "Can the Canopy Hold Water? and I calculated the surface temperature of the earth under Henry Morris’s water vapor canopy. Such a canopy would make earth hot as Venus. Needless to say, the creationist world didn’t like that paper. Thus I have had experience writing and defending my work in this area. That paper was eventually accepted by YEC physicists as being correct, and the vapor canopy fell out of favor with YEC leaders by the early 1990s
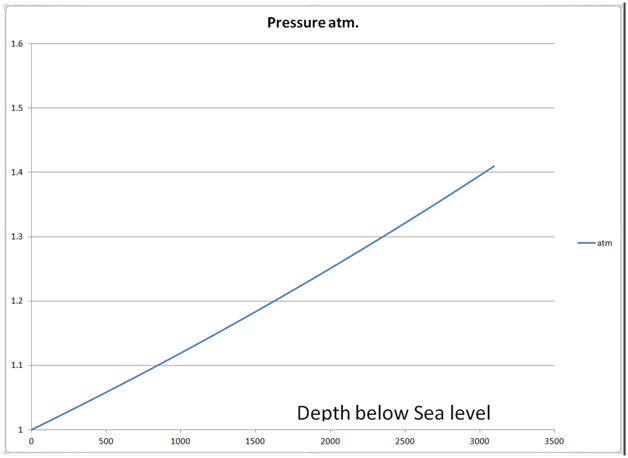
The pressure would be 1.4 atmospheres. I have checked that there is no danger of caisson’s disease (decompression syndrome) because no one could climb up fast enough to cause it. Sealab occupants lived at 6 atmospheres for extended periods of time, although they did need a special atmosphere.
I mentioned this model in a previous post and mentioned that I had been thrown for a loop on the cool temperatures determined from the halite inclusion data (mentioned in a previous post). It showed that the salt deposits at the base of the Med were deposited at an average temperature of 18-20 deg C. This places strong limits on an atmospheric temperature profile.
Plant pollen temperature calculations also agree with these temperatures.
"For the post-evaporitic interval CAM reconstructions are available for Maccarone (Fauquette et al., 2006: ca 5.5 Ma to 5.3 Ma), where MAT is evaluated between 16 and 20°C for most spectra, but up to 23-24.5°C for a few others, with most likely values oscillating between 17 and 20°C (only one spectrum shows a lower MLV around 15°C). MAP is less stable along the succession. The first part of the sequence is characterized by large intervals, from around 400 to 1300 mm - MLV 1100 mm -, and smaller intervals from 1100 to 1300 mm, whereas the second part of the Messinian is characterised by more precise ranges from 700 to 1300 mm with MLV around 800 to 1200 mm. Bertini A.; Martinetto E… Messinian to Zanclean vegetation and climate of Northern and Central Italy / - In: BOLLETTINO DELLA SOCIETÀ PALEONTOLOGICA ITALIANA. - ISSN 0375-7633. - 47 (2)(2008), pp. 105-121., p.117
I have been unable to replicate 18-20 deg C for the average temperature at the bottom of the Mediterranean, we know from two facts that it wasn’t too hot. First there are the animals who lived down in that pit. The problem comes from the adiabatic lapse rate. Every kilometer one drops into a basin, the hotter the air becomes from the starting point. To generate a model matching an 18-20 deg C average temperature in a 3 km deep basin requires a starting point at sea level of freezing. The only solution I can think of to match these two data points is to have a semi-permanent temperature inversion, but I don’t know how realistic that might be.
From Britannica: If the land is rolling or hilly, the cold air formed on the higher land surfaces tends to drain into the hollows, producing a larger and thicker inversion above low ground and little or none above higher elevations. Temperature inversion | Definition & Facts | Britannica
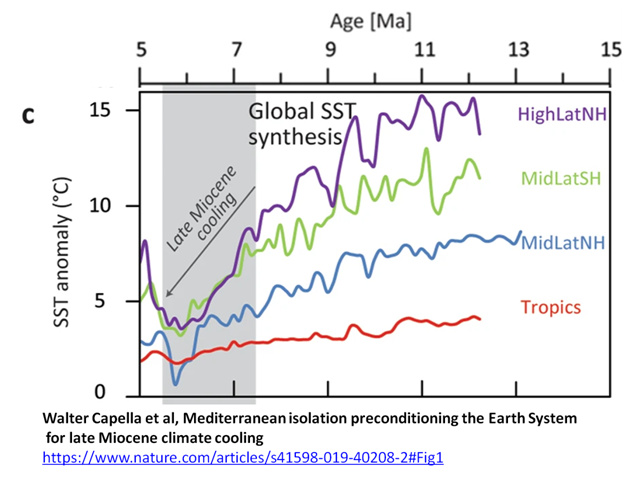
In this cold time on earth (see below), when Antarctic glaciations has recently started, could it be that cold air collected in the Mediterranean? I don’t know and the idea is no longer verifiable.
My inability to match the two temperature calculations above, does not mean life didn’t live in that basin. We know from paleontology that elephants, Myotragus, hippos, giraffies etc lived numerously in that basin. This failure to match the temperature target does not invalidate my thesis of this being Noah’s flood.
This problem also required a closer look at the variation of lapse rate with pressure. I found an interesting chart on that issue. Most people use a constant lapse rate for quick approximations but the lapse rate is not constant with pressure.
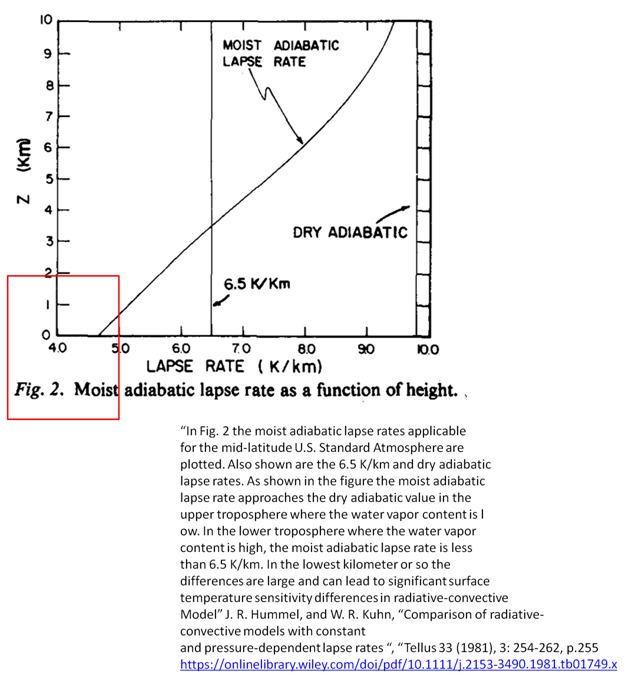
I used this as the basis for calculating interpolated lapse rates for varying relative humidifies. The red box is the region I show in my lapse rates. In this region the change with depth has become small so I used linear extrapolation down to -3 km thinking the error would not be much, and this is certainly less erroneous that using a constant lapse rate.
The model I built calculates the lapse rate and the temperature for each meter. These temperatures are probably closer to the maximum daily temperature. I would think they would somewhat mirror the range seen in the Okovango delta in Africa, which is in the midst of a delta.
Temperature (°C)
| Jan | Feb | Mar | Apr | May | Jun | Jul | Aug | Sep | Oct | Nov | Dec |
|---|---|---|---|---|---|---|---|---|---|---|---|
| 19/32 | 19/31 | 18/31 | 14/31 | 9/28 | 6/25 | 6/25 | 9/28 | 13/33 | 18/35 | 19/34 | 19/32 |
This range of 35 deg celsius (95 F) is in the range of what I calculated. The Okovango delta, which is a great analogue to what the dried out Mediterranean was like, has experienced 44 deg C (111 F). While a miserable day, with water and shade animals will survive this. I survived this kind of temperature in Oklahoma when I was growing up and my parents didn’t have air conditioning at the time.
"Botswana sets record high temperature. The temperature in Maun, a gateway to the world heritage site Okavango Delta in northwestern Botswana, reached 44 degrees Celsius, above the previous record of 43.3 degrees Celsius set in 1944 in the capital city of Gaborone, Botswana Press Agency (BOPA) reported Monday. Jan 11, 2016 Botswana sets record high temperature | News Ghana
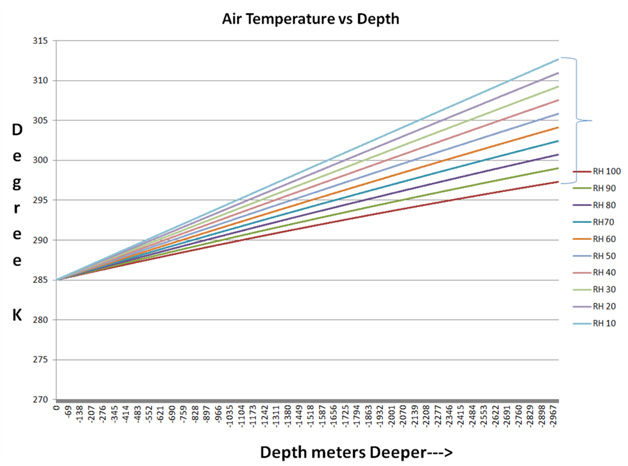
Below are the result from my model, starting with the lapse rate.
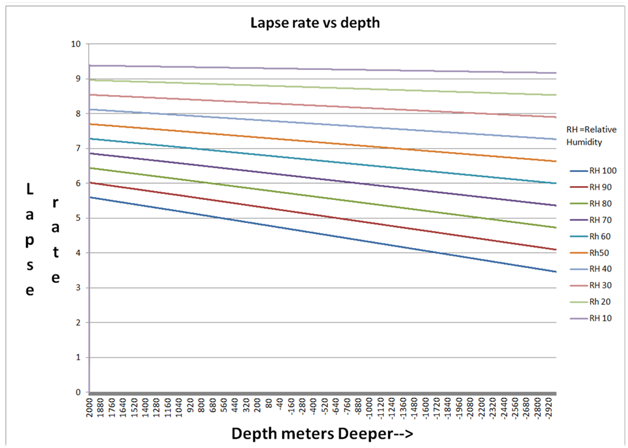
The lapse rates above are colored for various relative humidity values. The label at the top right is for the blue bottom curve.
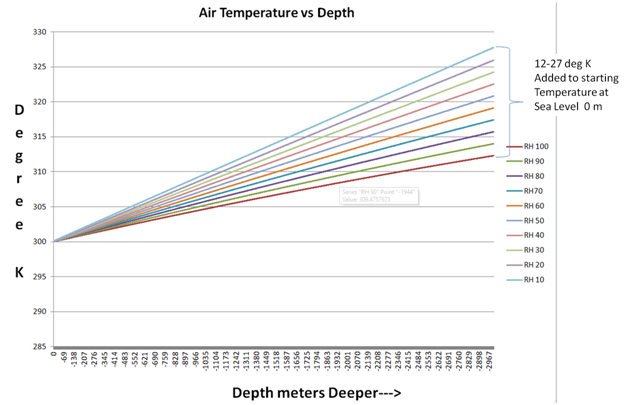
Using these lapse rates and starting at 300 K (27 C) we find that just descending into the basin adds 12-27 deg to the temperature at -3 km.The first picture I start with the sea level temperature as 300 K and the second picture starts at 285 K. As can be seen it is really hard to get the temperature at the bottom of this canyon to match the halite fluid inclusion temperatures. It is this that I base my rejection of those temperatures as being too cold. Absolutely dry air makes it hotter. The more moisture there is, the cooler the bottom temperature will be.
Were sealevel temperature reach 310 K( 98 F), only the higher relative humidity temperature values would be tolerable for long. The one argument I can give against such high temperatures, is that if that happened each year, many of the animals we find living in the Messinian in the Mediterranean basin would not have survived.
As I pointed out earlier, the upper Miocene was a time of great cold on earth.
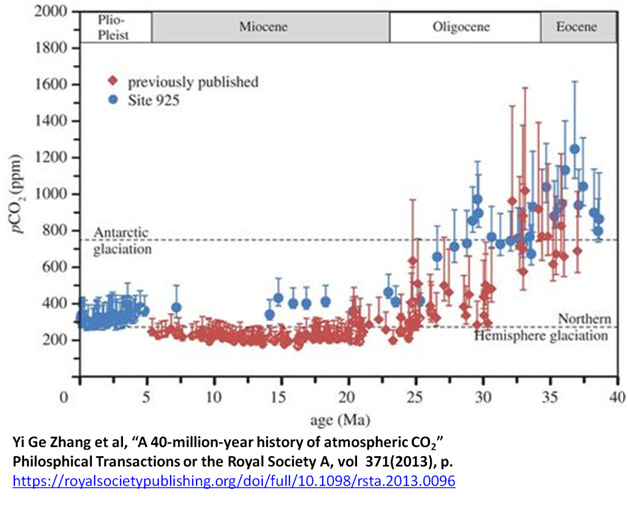
Part of this cold was due to a fall in CO2 from 1200 parts per million in the Eocene to about 250 ppm in the upper Miocene. See below red dots.
One thing people don’t generally know is that photosynthesis practically stops at 180 ppm CO2. The upper Miocene was coming awfully close to that limit.
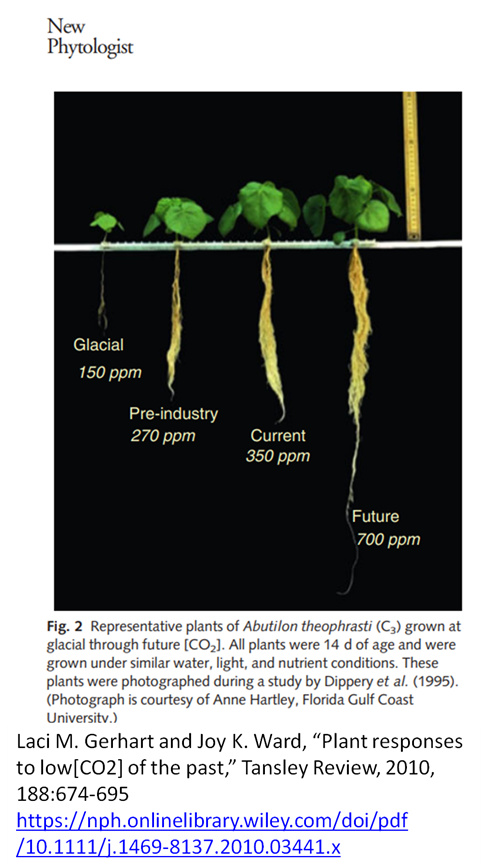
In this link is a chart on the first page that backs up the picture above showing that below 200 ppm CO2 plant growth almost stops. This is an agricultural fact sheet advocating that commercial greenhouses have much higher CO2 contents, going up as high as 1800 ppm. It increases the crop yield greatly, up to 100 percent in some cases.
The one thing I am unsure of in the model is what should be the starting point for the temperature at sea level and how does it vary throughout a Miocene year?
I calculated dewpoints, which are the temperatures at which water will condense, regardless of how slowly it rises–that is simply not part of the equation. I used the approximation at Dew point - Wikipedia. It is accurate to within a degree as long as the relative humidity is above 50%.
Given the claim made that slowly rising air won’t condense, I would like to point out two examples. Air inside a greenhouse has an upward velocity of zero!. All it takes for the moisture to condense on the glass is for the temperature of the inner glass pane to drop to the dew point inside the greenhouse. Secondly, one often sees fog in a valley in the fall. The rate of upward movement is again. Again, all it takes for that humidity to condense is for the temperature to drop to the dew point. It matters not what the speed of uplift is or isn’t, dew point temperature controls when the moisture will condense to liquid.
Below is a list of dewpoints for air starting at -3km for various relative humidities.
starting at 300 K at seal level.
RH]]]]]]]]]]]]]]]]]]]]]]]]]]]]] 100 ]]]]] 90 ]]]]] 80 ]]]]]70 ]]] 60 ]]]][ 50
elevation of dewpoint -2999 -2522 -2177 -1564 -1386 -1238
temperature at -3 km ]]] 312.]] 314. ]] 315.]] 317]] . 319.]] 320.
The brackets are to achieve formatting. Can’t find a character that is less intrusive
All parcels of air which have 50% relative humidity and above will reach dew point prior to their being pushed out of the basin. The influx of water will uplift all parcels of air and they will dump much of their water as they rise and leave the basin. Even considering tthe +/-1 degree uncertainty in dew point calculation due to the approximation, each parcel of air still will begin to condense its load of water before they leave the basin. The range of uncertainty for each relative humidity level above lies below sea level. This would be a monstrous and monstrously long rain storm and the basin filled for a year with 4-7 m per day. Once a parcel of air starts raining, it will continue to rain from it until it leaves the basin. This is because the parcel of air will be saturated the rest of the trip up and out of the basin.
Further, I expect that the rim of the Mediterranean experienced rainfall as well. The basin contained 0.16% of the world’s atmosphere. This much air being pushed out of the basin would spread out in what would best be described as air flows moving in all directions away from the Mediterranean. Any movement of the air up hills would cause further rain. This would be an unprecedented event in earth history.
Now, some will likely criticize this for not being a 40 day, 40 night storm, since I like these stories verifiable. One might be correct in that criticism given my other assumptions, unless, 40 days and 40 nights is a euphemism for a long time. Otherwise, I will plead guilty to a violation of my desire to have things in Scripture to be verifiable. One thing I have learned over the years, new information will eventually come up to clarify things I don’t currently understand.