“fought back”??? That comes across as an innuendo that some random student threatened the presumptions of astrophysicists.
Intermittent solar events are hardly unknown, and they have an effect on the atmosphere, so that is a default explanation. A close proximity supernova from AD 774 should leave a easy to spot remnant similar to the crab nebula, but there is none associated.
I don’t think this statement is correct. The gray field on each side of the data line indicate possible variability, and the data line is extrapolated from that. Of course the extrapolation could be in error, but the overall trend is clear, even if one drew the data line differently.
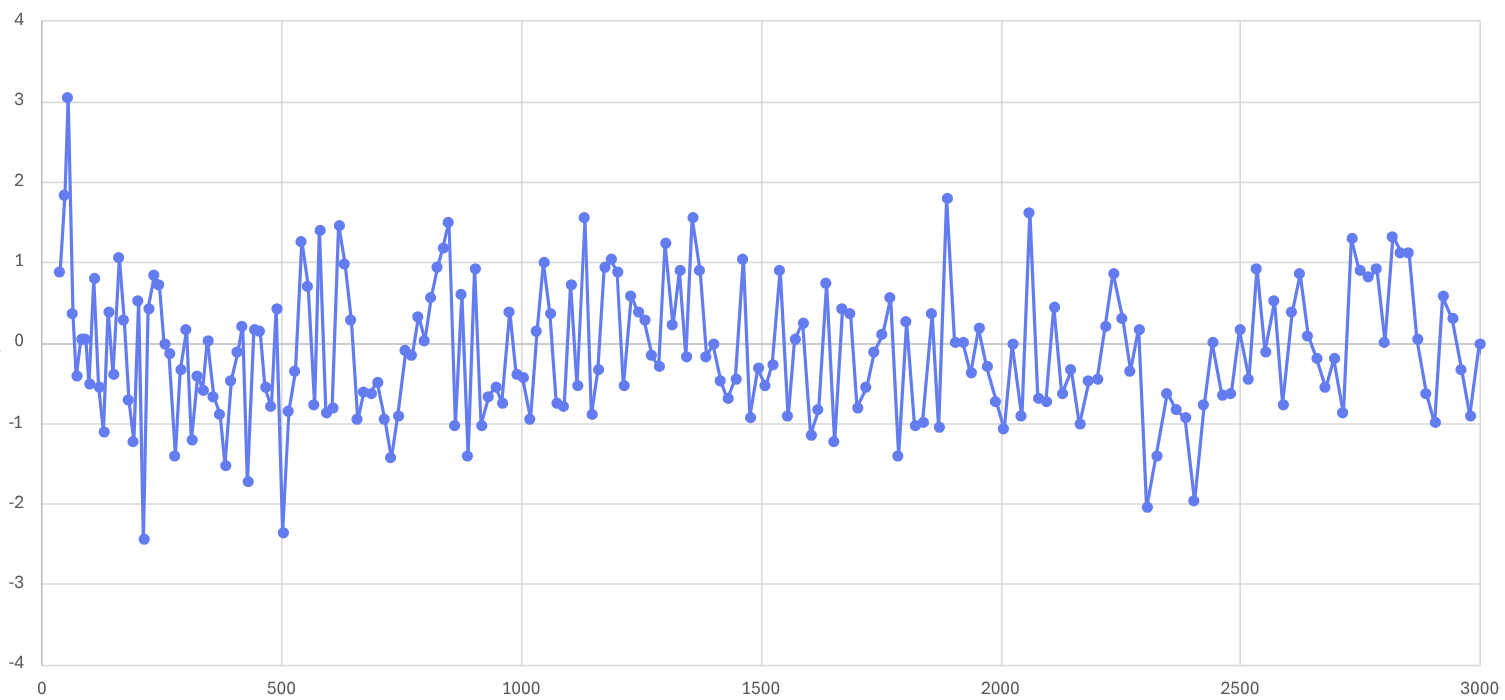
I am still trying to make heads or tails of the one graph you shared.
And from the failed but fascinating presidential candidate: “The devil’s in the details.”
It’s obvious that the temperature on Earth is not uniform.
It is demonstrable that there are recorded temperature trends at numerous fixed locations around the planet. And many of those temperatures have been being measured for quite a long time.
So, to say the value of Earth’s temperature = x, is silly. To say there are similar trends in temperature change at some collection of points around the globe is reasonable. And it’s happening.
I’m rather partial to US navy sea temperature maps from the early 20th century. But that’s just a short time.
Note that Schernikau’s slide is titled “Speed of Modern Temperature: Change is NOT unprecedented”. However, that is data from measurements of ice cores taken from one location in the Antarctic (Dome C). The graph is two degrees of separation from the original, Science paper (via Joseph Fournier and then included in a slide set by Lars Schernikau).
Original paper here. J. Jouzel et al. Science 10 Aug 2007 Vol 317, Issue 5839 pp. 793-796
The plot attributed to Fournier references data from the paper. The URL listed in the figure doesn’t seem to work for me but this works. Each point is the data for a bag of ice (~55 cm long) from the coring. I also plotted the data (below). A reason it may look different is that Fournier did 5-point rolling averaging for smoothing. Because the ice bags cover more years the deeper they were taken (ice compression?), this creates averaging of around 50 years for samples near present to about 80 years 3K years ago.
“They” definitely want to hide the variability. I remember a day in Minneapolis when the temperature rose 70deg F in 8 hours but the reported global average temperature barely shifted at all. I wonder what ‘their’ true intentions were, saying that the variation was ‘local’ and that Fairbanks AK had a particularly chilly day. We should also investigate why Fournier applied 5-sample, rolling averaging to his plot – What variability was he hiding by smoothing the figure and thereby keeping the temp anomaly under 1degC?
Alternatively, one might propose that it’s reasonable and actually sound science to develop a composite metric that aggregates individual measurements in order to see the net changes on a global system. Data aggregation is just going to average out much of the noise of individual measurements across the globe and make it easier to assess longer duration changes. That’s basic sample processing and stats work. One may argue about the best way of aggregating and applying weights to the data sources, and one may argue about the best way of determining energy flux in or out of the Earth, but working towards dealing with noise in data is sound science. Pointing to one spot of the globe and extrapolating to global climate variation is not.
Edit: The ice core data in the paper cited goes back 800k years. That range of data was used to investigate orbital and other long period perturbations in temperatures. The authors used a number of smoothing and filtering techniques to pull out the low frequency (long period) signals in the data.
Richard Lindzen is a contrarian - immoral - who not only is a ‘beneficiary of Peabody Energy, a coal company that has funded multiple groups contesting the climate consensus’, but also ’ claims that lung cancer has only been weakly linked to smoking’.
I have no idea what point William B Walters was trying to make about the ‘spike in C-14 production in the year 774-775 AD’. RON SEWELL’s links give perfect explanation. It’s The Sun Wot Won It - Wikipedia. How it furthers his denialism I do not know.
@Argon, recreating the graph and refiguring the averages is beyond generous.
Too bad that speed of change table ends at 1950. I’m assuming that’s when the cores were cut and pulled. But what has happened in the last 75 yeas is the key to the arguments, too.
Regarding the point @wbwane quoted by Richard Lindzen:
With graphs on my mind, I didn’t think much about this until the middle of the night.
I understand that scientists work with vastly complex systems, especially something like the history of the climate of an enture planet. But to say “it’s too complex to really determine anything”? “It’s all a matter of interpretation?” That seems defeatest at best. I will refrain from ascribing motives as I am unqualified to make such evaluations.
However, when the costs of addressing a problem most affect the people whose financial interests benefit from not addressing it, and the people most to be harmed by not addressing a problem are the poorest and least able to improve their own situations, I become suspicious.
Because power and the will to maintain it is a powerful bias for the status quo.
Perhaps Peabody Coal WANTED THE SMARTEST, BEST, CLIMATE SCIENTIST IN THE WORLD AS A CONSULTANT. There is no climate consensus. I heard good story about Heisenberg who was one of the inventors of quantum mechanics. He had headed the German WWII nuclear program and was forbidden to work in nuclear science after the war. So, he chose to work in fluid mechanics, involving the Sturm-Liouville equation that is involved in solving atmospheric turbulence and other effects on climate. Without much success. One of his students approached him and said he had head that, upon death, the Almighty would permit the new arrival to ask two questions. What would yours be? Heisenberg is reported to have said…1 explain general relativity; 2. explain the math of turbulence. The student replied…”Well, Dr. Heisenberg, I think you will get a good answer for the first one, but, I am not sure about the second. In other words, the math and connections for climate modeling is far too hard for there to be any “so-called” consensus by political scientists, news reporters, failed Presidential candidates….and most of the rest of us. Nobelist, John Clauser has discovered the same thing.
All old contrarians, typical of old scientists, no longer practising science, destroying their reputations, the epitome being Hoyle. Even Einstein since Copenhagen.
I’m not so sure I would trust the student to know this, although s/he was surely confident s/he did. Nevertheless, the student’s view on the matter seems irrelevant to me.
Technically, a “consensus” is a general agreement of opinion, but the scientific method steers us away from this to an objective framework. In science, facts or observations are explained by a hypothesis (a statement of a possible explanation for some natural phenomenon), which can then be tested and retested until it is refuted (or disproved).
As scientists gather more observations, they will build off one explanation and add details to complete the picture. Eventually, a group of hypotheses might be integrated and generalized into a scientific theory, a scientifically acceptable general principle or body of principles offered to explain phenomena.
As federal websites are subject to political whims driven by money, the page linked above may either disappear or be changed. The Internet Archive’s Wayback Machine will become more and more essential to U.S. government document researchers.
Lindzen doesn’t deny that anthropogenic CO2, methane and other greenhouse gases are heat trapping and warming the Earth. His main beef seems to be about the degree of forcing from these gases and potential negative feedback the reduces the effects. This would put him among the group described as ‘lukewarmers’. He has proposed cloud cover (Iris hypothesis) as providing substantial negative feedback but it appears that his model is not considered supported by data or viable among most other scientists in the field. He suggested some years ago that the warming trend should significantly reduce to much lower levels than predictions and it’s getting close to the time horizon for comparison. So far, he looks off track again.
One can gossip about ulterior motives and psychology in all sides but data should matter most.