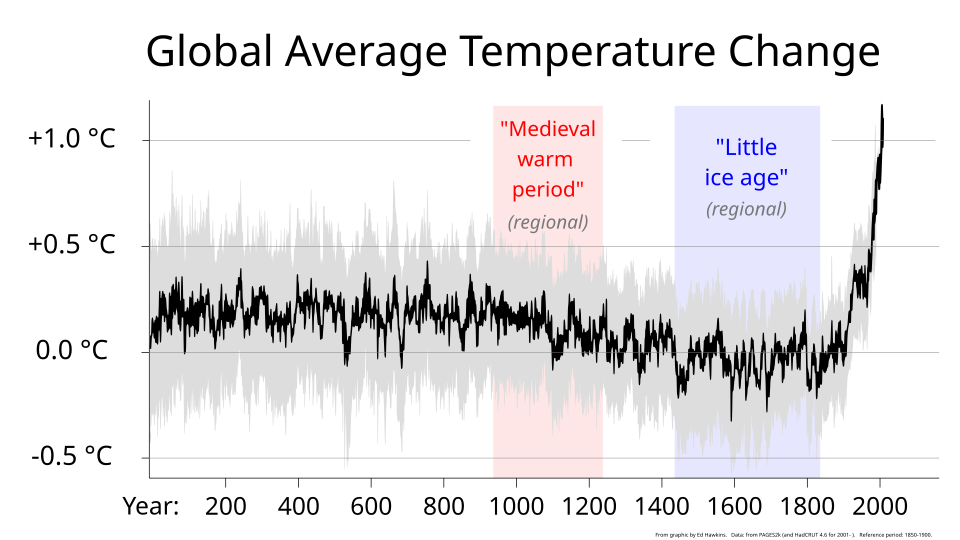
Thank you Professor. I see the regional medieval warm period and the little ice age, correlating very well with T’s global picture.
By the way, I couldn’t agree more on climate hysteria. Loved Apocalypse Never. Annihilated my anti-nuclear hysteria instantly. Apart from the fact that nuclear annihilation as far more, orders of magnitude more, likely than global mortality increasing beyond hundreds of thousands extra a year the next quarter century. When we get to 4 degrees in the next half, that should warm up a bit. A million a year by century’s end. But don’t worry, it will vastly be poor brown people. And the same amount for traffic fatalities.
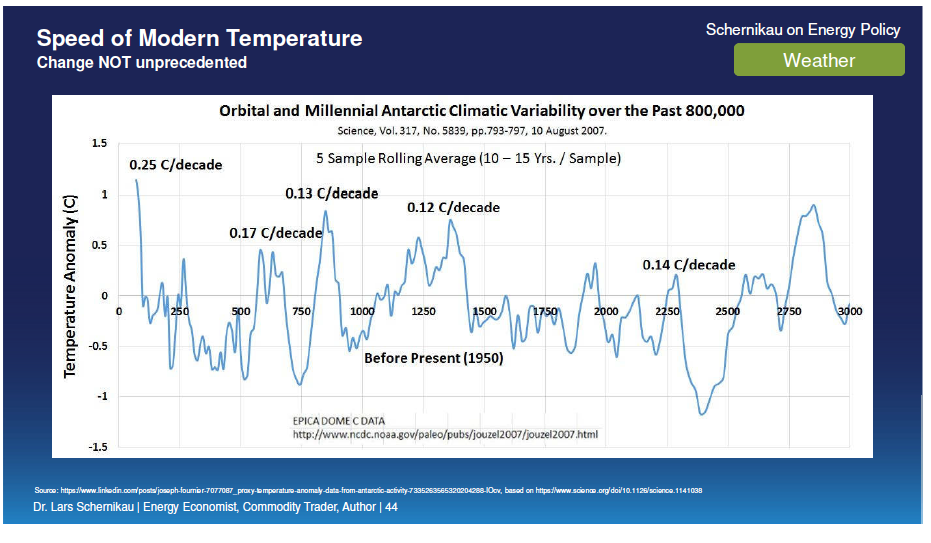
No grapes in the year 1000 in Greenland. That graph is poorly labeled as “change”. It is just temperature. Change would be a differential measure with the units in value/time.
Riiiight. Your beholder’s share. Nobody else here has any problem interpreting that data. Your graph shows the rate of change at temperature, going back 3,000 years out of 800,000, presumably years, in the title. When was the last time grapes grew in Greenland? Be careful how you answer there.
Hey, I appreciate you sharing this, but I’ve got some concerns about the CO2 Coalition as a source - and some of the specific claims here don’t hold up. Let me explain:
On the witch hunt analogy:
The comparison falls apart because Medieval people attributed climate change to magic with no physical mechanism while torturing confessions out of people. Modern climate science is based on measurable physics - we can literally put CO2 in a lab and measure how it absorbs infrared radiation. This has been understood since the 1850s (Tyndall, Arrhenius) as @t_aquaticus noted. The evidence types couldn’t be more different.
On that graph:
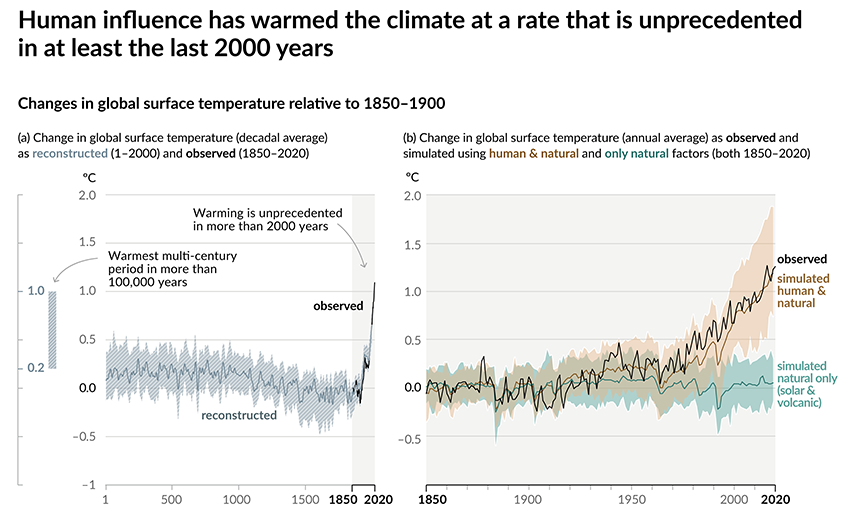
Look closely at the bottom - it stops in 1947. That’s not an accident. If you extend it with actual temperature data through today, we’re now about 1.2°C warmer than pre-industrial baseline, which is warmer than the Medieval Warm Period peak. The paper this comes from (Loehle 2007) has major problems - even the author said it wasn’t meant to represent global temperature, and it had dating errors that required a correction.
On 1650-1850 warming:
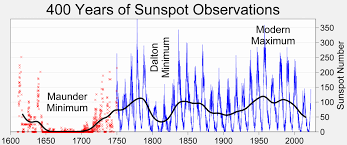
We actually DO know what caused it! The Little Ice Age cooling was driven by low solar activity (Maunder Minimum) and increased volcanic activity. As the sun’s output recovered and volcanic activity decreased, temperatures rose. This is well-documented, not mysterious.
They didn’t stop - we can still measure solar and volcanic forcing. But here’s the key: since about 1950, solar activity has been flat or declining slightly. Natural forcings alone would predict slight cooling. Instead, we’ve seen rapid warming that matches the increase in greenhouse gases almost perfectly. CO2 didn’t “replace” natural forcings - it just became the dominant one. Again @T_aquaticus showed you just this:
Water vapor IS a major greenhouse gas, but here’s the critical difference: it’s a feedback, not a forcing. The atmosphere can only hold water vapor based on temperature (it rains out in ~10 days). You can’t independently increase water vapor levels. But CO2 stays in the atmosphere for centuries. When you add CO2, temperatures rise, and warmer air holds more water vapor (about 7% more per degree C), which amplifies the warming. CO2 is the dial on the thermostat; water vapor is what amplifies the effect.
About the source:
The CO2 Coalition is funded by fossil fuel interests. The author (Craig Loehle) works for a timber industry research organization and regularly speaks at Heartland Institute conferences funded by ExxonMobil and the Koch Brothers. This isn’t independent climate science - it’s advocacy dressed up as research.
I’m happy to dig into any of this further if you want. The science here is actually pretty solid - and yeah, sometimes inconvenient.
The quicker we run out of oil and gas, 30 years?, the quicker the next ice age can start. In one hundred thousand years. Of course we can easily bring that forward to now with the nuclear war.
Potholer54 is the YouTube channel for journalist Peter Hadfield. He’s uploaded numerous videos debunking climate change ‘skeptics’. The blog ‘RealClimate’, with contributors actually engaged in climate science, is also a good technical source for understanding the scientific context, dissection and countering correction for most of the information William has presented.
And that’s all I’m going to add to this discussion. I’ve followed this BS pushed by a handful of repeatedly cited skeptics and amplified by a few ‘coalitions’ for over a couple decades and it’s always the SSDD.
OK, the prof’s gone off. I trust he’s well. The last time grapes could have [been] grown in Greenland was in the fifteen thousand years of the Eemian Interglacial before one hundred and fifteen thousand years ago.
The botany professors I studied under had predicted we would find that rise in that period for a simple reason: deforestation of Europe. It started in the late fifteenth century and accelerated to the point where various powers were planting colonies just to provide timber for shipbuilding.
What graph are you looking at???
False focus fallacy: just because one item excels at something does not mean that others do not contribute.
Sounds like you have an answer.
What do you think happened?
What are the similarities and differences in the state or components of the system then vs now?
Al I got is my moth-eaten high school science classes from about the time of that earlier warm up.
There is considerable discussion about the role of the Sun. One measure of the variability of Solar energy is the fluctuation C-14 production. It has been possible to use tree-ring data and credible history facts to prepare corrections to raw C-14 decay data. And, there are the Milankovitch Cycles. The shortest is 11,000 years. That is the cycle that moves the location of the North Pole. And, even more difficult to explain are the Younger Dryas changes.
Where could a lay person like me find information about the role of the sun, the significance of variation of carbon 14 production, tree ring corrections of carbon 14 dating, the role of Milankovitch Cycles, and anything about Yonger Dryas changes?
All in relation to the earlier fluctuations of earth’s temperatures?
I wonder how these factors agree or diagree with what @T_aquaticus and @pevaquark mentioned earlier. What is the significance of that agreement or disagreement.
I am also curious about measurements of ocean temps. We do have at least a few hundred years of them, I think. Wondering about older indications.
Changes in temperature of that much material seem significant.
At least to me.
Looking back up thread, I remembered I wanted to ask about these two graphs. They are obviously showing something different.
I am fairly confident I understand the second but not the first.
Speed of temp change in number of deg per decade either positive or negative. Ok. But change from what? What is zero on the x axis?
And who is imagining the future on that graph and on what basis? And with what sense of accuracy?
I’m sure I’m missing a lot more.
Here is a link to the tree-ring story….which is really one part of Solar variability. But, let me tell a story about tree-ring studies. Back in 2012, there was an article published in Nature
reporting a spike in C-14 production in the year 774-775 AD. That paper caught the eye of a biochemistry student at the University of California who noted that there was an entry in the Anglo Saxon Chronicles recorded by monks in English Northumbria ““A.D. 774. This year the Northumbrians banished their king, Alred, from York at Easter-tide; and chose Ethelred, the son of who reigned four winters. This year also appeared in the heavens a red crucifix, after sunset; the Mercians and the men of Kent fought at Otford; serpents were seen in the land of the South-Saxons.” The student suggested that the “red crucifix” was caused by a supernova whose energetic protons caused the spike in C-14 production. Needless to say, the professional astrophysics community fought back and suggested that some “Solar event” led to the spike. Mysterious radiation burst recorded in tree rings | Nature
Of course, on its own, a statement like this could mean a great many things and have a great many explanations. Even if we could be sure what the writer was recording and how accurately, etc.
If it were a significant celestial event, others will have recorded something, as well.
But it would probably take a number of interpretive angles to have enough meaningful information to us now to say precisely what had happened.
Richard Lindzen has challenged the notion of a “global temperature". His point is that the idea was generated by the astronomers who were identifying exoplanets and making “global temperature estimates for these objects” and wanted something to compare with on Earth. His point is that an incredible amount of “data massaging” is required for such a value that such values tend to be “beauty in the eyes of the beholders”. Hence, the second graph is computed using data that produces as little variability as possible so that questions are not asked as to why the variability seen in the first graph exists. We have this maxim from the late VP of the US who stated that “there is little criticism caused by the things you don’t say”. The first graph comes from 2007 and the source is listed to that it is possible to see what methods are used. To answer your question, the authors of the second graph do not want to have to answer question about variability for which are are few useful answers. They would prefer data showing very little variability until the point where the concentration of atmospheric CO2 can be blamed.