Can someone explain like I'm 5 yo, what's wrong with this refutation of Biologos?

The discussions on genetic diversity, most recent common ancestors, pop modelling, and Adam and Eve has, imo, undergone such twists and turns over the years on this site, that I find it difficult to develop any coherent view of the protagonists. One extreme view seems to focus on Adam and Eve as the initial couple, and all humans are descended fro them over the past 6,000, while the other extreme insists there was no Adam and Eve, that all humans and primates have a common ancestor, and any differences are relatively minor, or a matter of degrees. There seem to be ‘in-between’ views, such as non-historic symbolic A&E, some type of archetype or representative A&E, and other views that, for the life of me, I cannot make any sense.

Since the EC view seems to oscillate about some type of Adam and Eve as a historic couple, and no couple but someone representative of modern humans, I have tried to understand this point of view based on various models on human population distribution. The interesting models use data that is: (a) historic - recorded for many centuries, and I suppose estimated from ancient times, using a stochastic model that accounts for a recent common ancestry based on a couple, and the current population and distribution forming over 6-10,000 years; and (b) data derived from genetics from a relatively large sample of modern human beings, and the genetic diversity is rationalised using a model that assumes a bottle neck of a relatively small population, and this spread from Africa, for over a lengthy period (I recall perhaps 1.6 million years, but I can be corrected on this). I have tried to point out the assumptions inherent in these approaches and caution against making biblical conclusions from them.

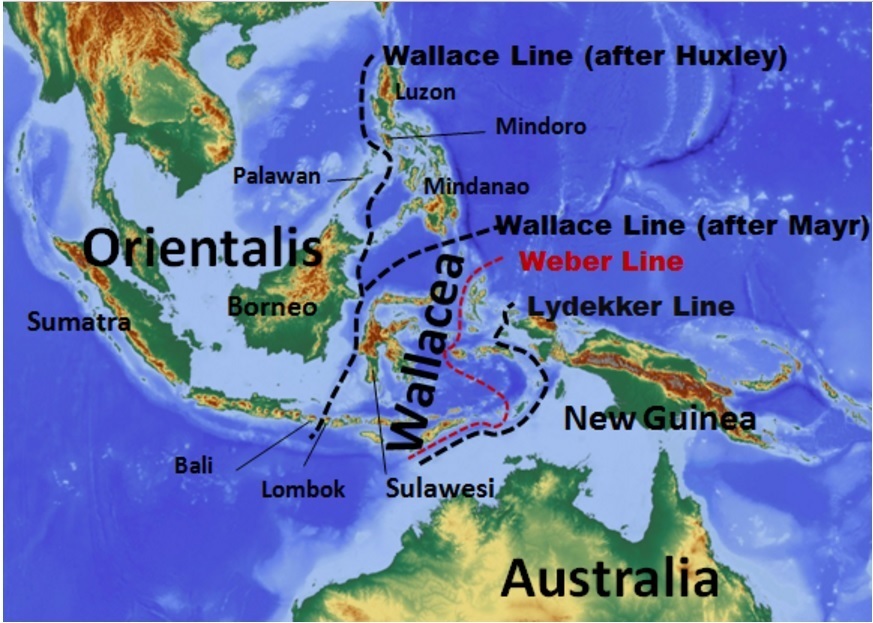
There are other reports, such as the one I referred to for Australians, and these require 20-40,000 years to account for genetic diversity, bottleneck and migration from New Guinea. Btw, artifacts, caves and paintings in Australia have been reported to be 40,000 years old, and these require a viable population to produce them.

My involvement in this tortuous discussion exchange over perhaps a year, has been to point out the assumptions built into any model, and to show that none of these replace or negate the Biblical story of Adam and Eve, as understood by Orthodox Christianity.

As an aside, I recall looking pictures of Adam and Eve and the picture of God’s figure imparting life to Adam (Michelangelo) and racked my brain to see if I could think of anything like these images in the Orthodox Churches I have attended. I could be wrong, but I cannot recall one icon or painting of this sort - I think this is one way of showing the different emphasis Orthodoxy may place on this subject matter.

In any event, I trust this detailed response (ramble) may be helpful to someone on this site.

There may be some confusion here about the difference between assumptions and conclusions. If a study of genetic data finds evidence for a genetic bottleneck in the population, the bottleneck is a conclusion of the study, not an assumption. Typically, the conclusion is reached by comparing data to the predictions of models with and without a bottleneck. An assumption might be the specific form of the bottleneck, or features that are shared between the models, e.g. the mutation rate.

The relevant question is how robust the conclusions are to changes the assumptions. The presence of a bottleneck is usually quite robust, while the timing of the bottleneck is not.

2 Likes

I have lost track of what exactly is being disputed in the last dozen or so posts… but it may well be that the “Wallace Line” is relevant to your future postings:

“The Wallace Line or Wallace’s Line is a faunal boundary line drawn in 1859 by the British naturalist Alfred Russel Wallace that separates the ecozones of Asia and Wallacea, a transitional zone between Asia and Australia. West of the line are found organisms related to Asiatic species; to the east, a mixture of species of Asian and Australian origin is present. Wallace noticed this clear division during his travels through the East Indies in the 19th century.”

“During ice age glacial advances, when the ocean levels were up to 120 metres (390 ft) lower, both Asia and Australia were united with what are now islands on their respective continental shelves as continuous land masses, but the deep water between those two large continental shelf areas was, for over 50 million years, a barrier that kept the flora and fauna of Australia separated from those of Asia.”

“Wallacea consists of islands that were not recently connected by dry land to either of the continental land masses, and thus were populated by organisms capable of crossing the straits between islands. “Weber’s Line” runs through this transitional area (to the east of centre), at the tipping point between dominance by species of Asian against those of Australian origin.”

“It can reasonably be concluded it was an ocean barrier preventing species migration because the physical aspects of the separated islands are very similar.[7] Species found only on the Asian side include leaf monkeys and ponderous-beaked hornbills while Australian wallabies, spiny anteaters, tree kangaroos and gliding possums are not.”

A model may provide an outcome of a number of individuals to account for the genetic diversity - this is a result from the model. Data (or the preferred term amongst some, evidence) is required to confirm or negate the conclusion, and such data may take the form of remains of a community consistent with the bottleneck - until this is provided, it can only be understood as a result of the model.

The example of Australia provides data that is consistent with a stable population (with a period twice that predicted by the genetics model) but not of anything that would be equated with a specific bottleneck. The other model (if memory serves) fails to provide any data for any population meeting the requirements of a bottleneck 1.6 m years ago. Therefore we must assume the results of the model (as well as other factors in the model) are valid, and we cannot assume or state these results are confirmed.

This seems to represent a fundamental misunderstanding. The genetic diversity for a population is a dataset, otherwise known as evidence. That evidence may support either a model with a bottleneck or a model without a bottleneck. Any conclusion drawn from that data about a bottleneck will be based on evidence. It’s nice if you can find confirmatory evidence of a different kind – consilience is an important feature of science, after all – but there’s no requirement that you do so to conclude that yes, a bottleneck occurred. As with any scientific study, there may be more or less confidence in the result, and more or less competence by the researchers. But there is nothing about the process here that means we have to withhold provisional assent until some other kind of data arrives.

This is entirely analogous to what high energy physicists do. They collect data from particle decays. To search for a particular decay mode, they model what their data should look like with and without the decay mode present, and see which one fits better. If the model with the decay mode is sufficiently better than the model without, then they publish a paper saying that they have detected the decay X->yz. No other data sources are required.

If you see weaknesses in a particular study, or contradictions between studies, we can certainly discuss them. What study of Australia are you talking about here?

2 Likes

Yes, this is correct, and the reason I have tried to keep my comments general, and bring the discussion back to the reason we are exchanging opinions (biblical doctrine), is not to indulge in an attack on this type of modelling, but to ask, “Are the results and assumptions sufficient to warrant a rethink of doctrines such as the so called original sin, and historic Adam and Eve?” Imo I cannot see anything so clear cut and detailed from genetic modelling that would cause me to rethink such doctrine.

If it is important I will try and locate the Australian study - my recollection is that it was publicised as an important result, and the person in question also admitted to (anticipating) some controversy - I suspect this comment caused me to listen, rather than another report on bottlenecks and so on.

As far as a general approach to modelling, my experience has dealt with complex chemical reaction mechanisms and reaction routes, and I have at all times based my conclusions on either (a) the results are validated based on experimental data, or (b) the results cannot be validated and are thus reported as speculative. If other modellers, within a different context, (for whatever reason) take a different approach, it is for them to come to their conclusions and discuss them in the appropriate literature. However, biblical doctrine is to me a different matter and requires more than a scientist’s preference and inclination, before I would question it.

Here is the talk. I’ll have to watch it later, but thanks to @Eddie for his glowing review and, of course, to @glipsnort for the talk itself. Sounds fantastic!

That’s me – thanks for your kind words. I did put a good deal of thought into that talk, and tried to pick kinds of evidence that could be explained without too many technical digressions.

There are generally complications and anomalies in the real world. In particular, in a process with billions or trillions of events, more than a few one in a million events will occur. The overall picture is very clear, though. What I would wish to hear from critics would be some kind of coherent explanation for genetic data that doesn’t include large-scale common descent.

Historically, a number of physicists have moved into genetics. More recently, a lot of people have moved into biology from fields with strong computational and mathematical components: physics, math and statistics, computer science and even electrical engineering. Traditional training for biologists did not equip most of them to handle large data sets and large-scale computing. These days, there is less of a need as there are more programs in computational biology/bioinformatics.

As for how I made the transition, I read some textbooks and applied for a job as a software engineer at a genome center, with the understanding that I wanted to do science. Then I learned on the job.

No, before becoming a physicist I was training to be a literary critic (although I’d already majored in physics by that time).

3 Likes

@glipsnort

I have just found this book that provides some interesting discussions, and one chapter deals with mathematical models of population ecology. I find this quote interesting:

The Undeniable Effectiveness of Mathematics in the Special Sciences, Mark Colyvan.

“I have argued that mathematics can play a number of useful roles in ecological theory. Mathematics can represent biological facts and it is often able to do this is such a way as to make certain biological explanations more accessible. Mathematics is well suited to drawing attention to similarities between apparently different systems (and often provide the appropriate level of abstract representation for investigating the similarities). This, allows each of these areas to learn from one another, and reduces duplication of research. Finally, I argued that there are explanations in ecology where the mathematics carries the bulk of the explanatory burden, and these explanations are appropriately seen as mathematical explanations of biological phenomena.”

A couple of remarks, late to the party.

First on Eddie’s exchange with Joshua etc on MRCA, which was a subject that I looked at even prior to the Hump of the Camel coming online in 2011. Eddie wonders about the refutation of Paul’s teaching that Adam and Eve were the ancestors of all humans whatoseoever.

I’m not sure Paul puts it that clearly, but in our scientific terms the concept is meaningless, because we have no definition of “human”, rather inconsistently thinking either of H sapiens, or of the genus Homo, or of a variable bunch of the higher species or hybrids of that genus…

Yet Paul’s concept of “man” corresponded to none of those biologically-based categories, but defined as human (his) present humanity, and those descended from Adam and Eve. If A&E were MRCAs in the sense of Rohde’s thesis, all that Paul says of Adam would be true, his definition of “man” covering all those linked by blood both to the covenant-relationship of God to Adam, and to the stain of original sin.

Whatever he might have assumed about the history of mankind, what he wrote under the Holy Spirit is what matters.

Talking of original sin, my second point is about the supposed conflict between east and west on this. I wrote on it here back in 2012.

Usually this is described in terms of an opposition between Irenaeus (East) and Augustine (West), but in fact (a) they are considering different theological issues, (b) they both regard the effects of sin in the world as being the direct result of Adam’s first sin, (c) although the Orthodox “ancestral sin” has a different flavour from Augustine’s it is still considered the cause of human death and originating in Adam, and (d) Augustine is a saint in Orthodoxy as in Catholicism: his views on original sin are held by many within Orthodoxy, to the extent that 20th Century Russian theologians seeking to refute it sold the idea in terms of Orthodoxy’s bondage to “foreign” western ideas.

The net result is that to divorce the question of sin and death from an historical Adam, you have to overturn not only western, but eastern tradition.

History should have taught us by now that western and eastern tradition are insufficiently reliable to be trusted over reality and the Bible itself. But I note yet again the complete lack of any attention paid to Second Temple Judaism and early Christianity. It’s like you people think Christianity started in the fourth century. It’s a huge blind spot, and that’s why you’re suffering.

2 Likes

I finally got around to playing with this some more. Here’s what I did. . .

I simulated two demographic histories for humans, one a conventional history as understood by science and the other a young earth model with a recent first couple and global flood. I used the same mutation rate for the two models: 0.2 mutations/genome copy/generation, which is equivalent to simulating ~0.5% of the genome. I assumed 25 years per generation. For both models, I sampled 60 individuals from the end population to compare to the 60 individuals in the 1000 Genomes data I previously posted.

The conventional model has a long-term constant-sized population of 15,000. 75,000 years ago the population started expanding exponentially until it reached 100,000 in the present. (The entire population is obviously much larger than this, but it isn’t a bad approximation for a local population a few thousand years ago. The rapid expansion post-agriculture only affects very rare variants, and will have negligible effect on the data I’m looking at.)

The YEC model 241 generations ago. It begins with a population of two, and doubles every generation for the first 10 generations, then expands more slowly, at just over 2% per generation. After 66 generations I reduce the population size to five, to model Noah, his wife and their three daughters-in-law. Then comes another 9 generations of doubling, followed by 2% growth again. This leads to the same final population size as the conventional model, 100,000. I added enough genetic variants to the original couple to make the two models have the same overall genetic diversity in the modern population (measured as the average number of pairwise differences). To make the initial variants look as much like the real data as possible, I assigned half of them one copy of the derived allele, a third two copies and a sixth three copies.

Here’s the comparison with the 1000 Genomes data (with the latter scaled down to match the simulated level of variation).

Conventional model:

Young Earth model:

4 Likes

Thanks for putting in the effort for your graph. Unfortunately, I am not as schooled in the science of biology as genetics as many of you, so I’m confused :slight_smile: It looks like the graphs are very similar, and therefore, it may be argued that the genetic data we have does not necessarily disprove a single pair of progenitors starting life as we know it. Is this a correct understanding? If so, what assumptions have to go in to the original pair and Noah’s family and are these assumptions realistic?

Which plots look the same to you? You should be comparing the red and blue lines on the second plot. Let me blow up the low-frequency end of the plot:


Do the blue and red lines look similar? The blue line is telling us that there are lots of genetic variants that are present in 5% or 10% of humans. That is, if you look at the DNA of a roomful of people, you’ll find lots of places in the DNA where a couple of people in the room share a mutated DNA “letter” there. (And by lots I mean hundreds of thousands of places.)

The red line tells us that a recent Adam (and Noah) couldn’t produce that pattern. There have been too few generations since Noah to accumulate a lot of new mutations (the new mutations are the spike at the left side of the graph) and no way to get them to 5% frequency. Any genetic variants already present in Adam and Eve will occur at all kinds of frequencies – in 10% of the population, 20%, 50%, whatever. Those variants are the flat red line across most of the graph.

The most important assumption I made in creating the red line was that the mutation rate has been constant throughout our recent history.

4 Likes

Thanks for the explanation, I must have been confused by the data. So, what is the practical explanation for the middle of the graph? At point 0.06 for example. Blue line is at 1800 approx, and the reddish line is at fewer than 500. What does it mean? Unfortunately, I have zero schooling on this so imagine that I’m an inquisitive 15 yo

Your inquisitiveness has already developed from that of someone aged 5 years to that of someone aged 15 years since the moment you started this thread. So it appears the answers people provided here did help you with your questions :slight_smile: .

1 Like

It means,

  1. the YEC model (the red line) predicts fewer then 500 variants that appear in approx 6% of the population.
  2. the data (the blue line) indicates that about 1800 variants appear in approx 6% of the population.
  3. there is a big difference between these numbers (more than three-fold).

Compare this with the evolutionary model (click to get there)…

  1. the evolutionary model (the red line) predicts about 1800 variants that appear in approx 6% of the population.
  2. the data (the blue line) indicates that about 1800 variants appear in approx 6% of the population.
  3. the numbers are nearly the same.

So “some” might conclude that the the YEC model does not fit the data, and the evolutionary model does.

3 Likes

This topic was automatically closed 6 days after the last reply. New replies are no longer allowed.