Joshua, I am so sorry to hear this. You and your family are in my thoughts and prayers.
1 Like
Josh, so sorry to hear this. I will be praying for you and your family.
1 Like
Just to come back to points raised by @GJDS and @Jon_Garvey that I did not get a chance to respond to earlier:
I am not sure if this is relevant to your question, and you probably are well aware of this already, but just in case it is useful to the discussion, here are some comments.
There is quite a large literature modelling the population genetic effects of severe bottlenecks on genetic diversity in populations, by, amongst others, Alan Templeton, Brian Charlesworth, Nick Barton and Masatoshi Nei. This was partly motivated by a debate about whether or not founder event bottlenecks can cause speciation (note, the debate was not about whether or not severe bottlenecks can happen - it was about whether they drive evolutionary change). This led to quite a lot of empirical studies on natural populations that were known to have passed through bottlenecks (evidenced by past human observation and records) and on experimental populations. For example, here is a recent paper that experimentally shows that populations do much better after a bottleneck if the founding couple are outbred rather than inbred previous to the bottleneck: Szűcs, M., Melbourne, B. A., Tuff, T., Weiss‐Lehman, C., & Hufbauer, R. A. (2017). Genetic and demographic founder effects have long‐term fitness consequences for colonising populations. Ecology letters, 20(4), 436-444.
I think it is fair to say that models of the effects of bottlenecks on genetic diversity are well developed and well tested. Of course, there are inherent limits to how well we can test the long term effects of bottlenecks in natural populations or experiments, as we are limited in the number of generations that we can study. I guess this is the major problem that you were both pointing out.
Perhaps the best empirical study available to us on the effects of bottlenecks is the Lenski long-term evolution experiment. Though this has the disadvantage of being on an asexual organism, it has the advantage of having run for 60000 generations. This experiment started with an extreme bottleneck, as each of the 12 parallel populations came from the same bacterial colony. Lenski et al (1991) wrote: “over all the founding populations, there was essentially no genetic variation either within or between populations, excepting only the neutral marker.”
Recently a fantastic study was done by Lenski and his collaborators tracking the genetic changes that have occurred in each of the 12 populations that all originated at the same time with the same bottleneck.
https://www.nature.com/articles/nature24287
The results are quite startling, in that very different dynamics have occured in each population. Here are the allele frequency trajectories for just three of the populations, from Figure 1 of the paper:
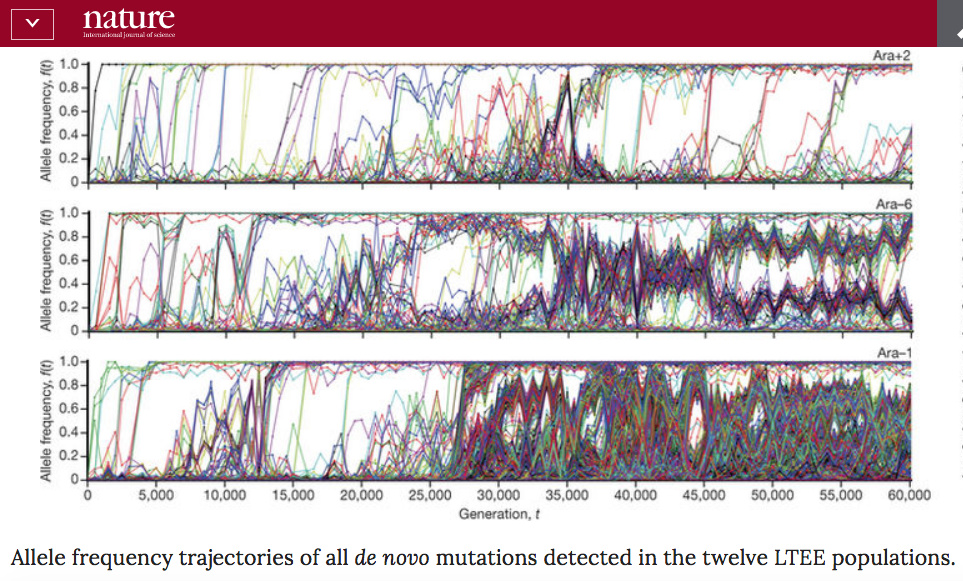
The authors found that the different dynamics were for several reasons, including: changes in mutation rates, periodic selection, and negative frequency dependent selection. The final paragraph of the paper reads:
“Together, our results demonstrate that long-term adaptation to a fixed environment can be characterized by a rich and dynamic set of population genetic processes, in stark contrast to the evolutionary desert expected near a fitness optimum. Rather than relying only on standard models of neutral mutation accumulation and mutation–selection balance in well-adapted populations, these more complex dynamical processes should also be considered and included more broadly when interpreting natural genetic variation.”
I think this perhaps supports the point you were making. It is a very very different system to human populations, but in many ways it should be a simpler system, and therefore easier to model. It underlines the difficulty of going from models to real evolution.
If we were presented with the twelve different Lenski LTEE populations that exist today and asked to reconstruct their past, I very much doubt we would be able to detect the fact that they all went through the same bottleneck 60000 generations ago.
4 Likes
@RichardBuggs Thanks for the reply, Richard.
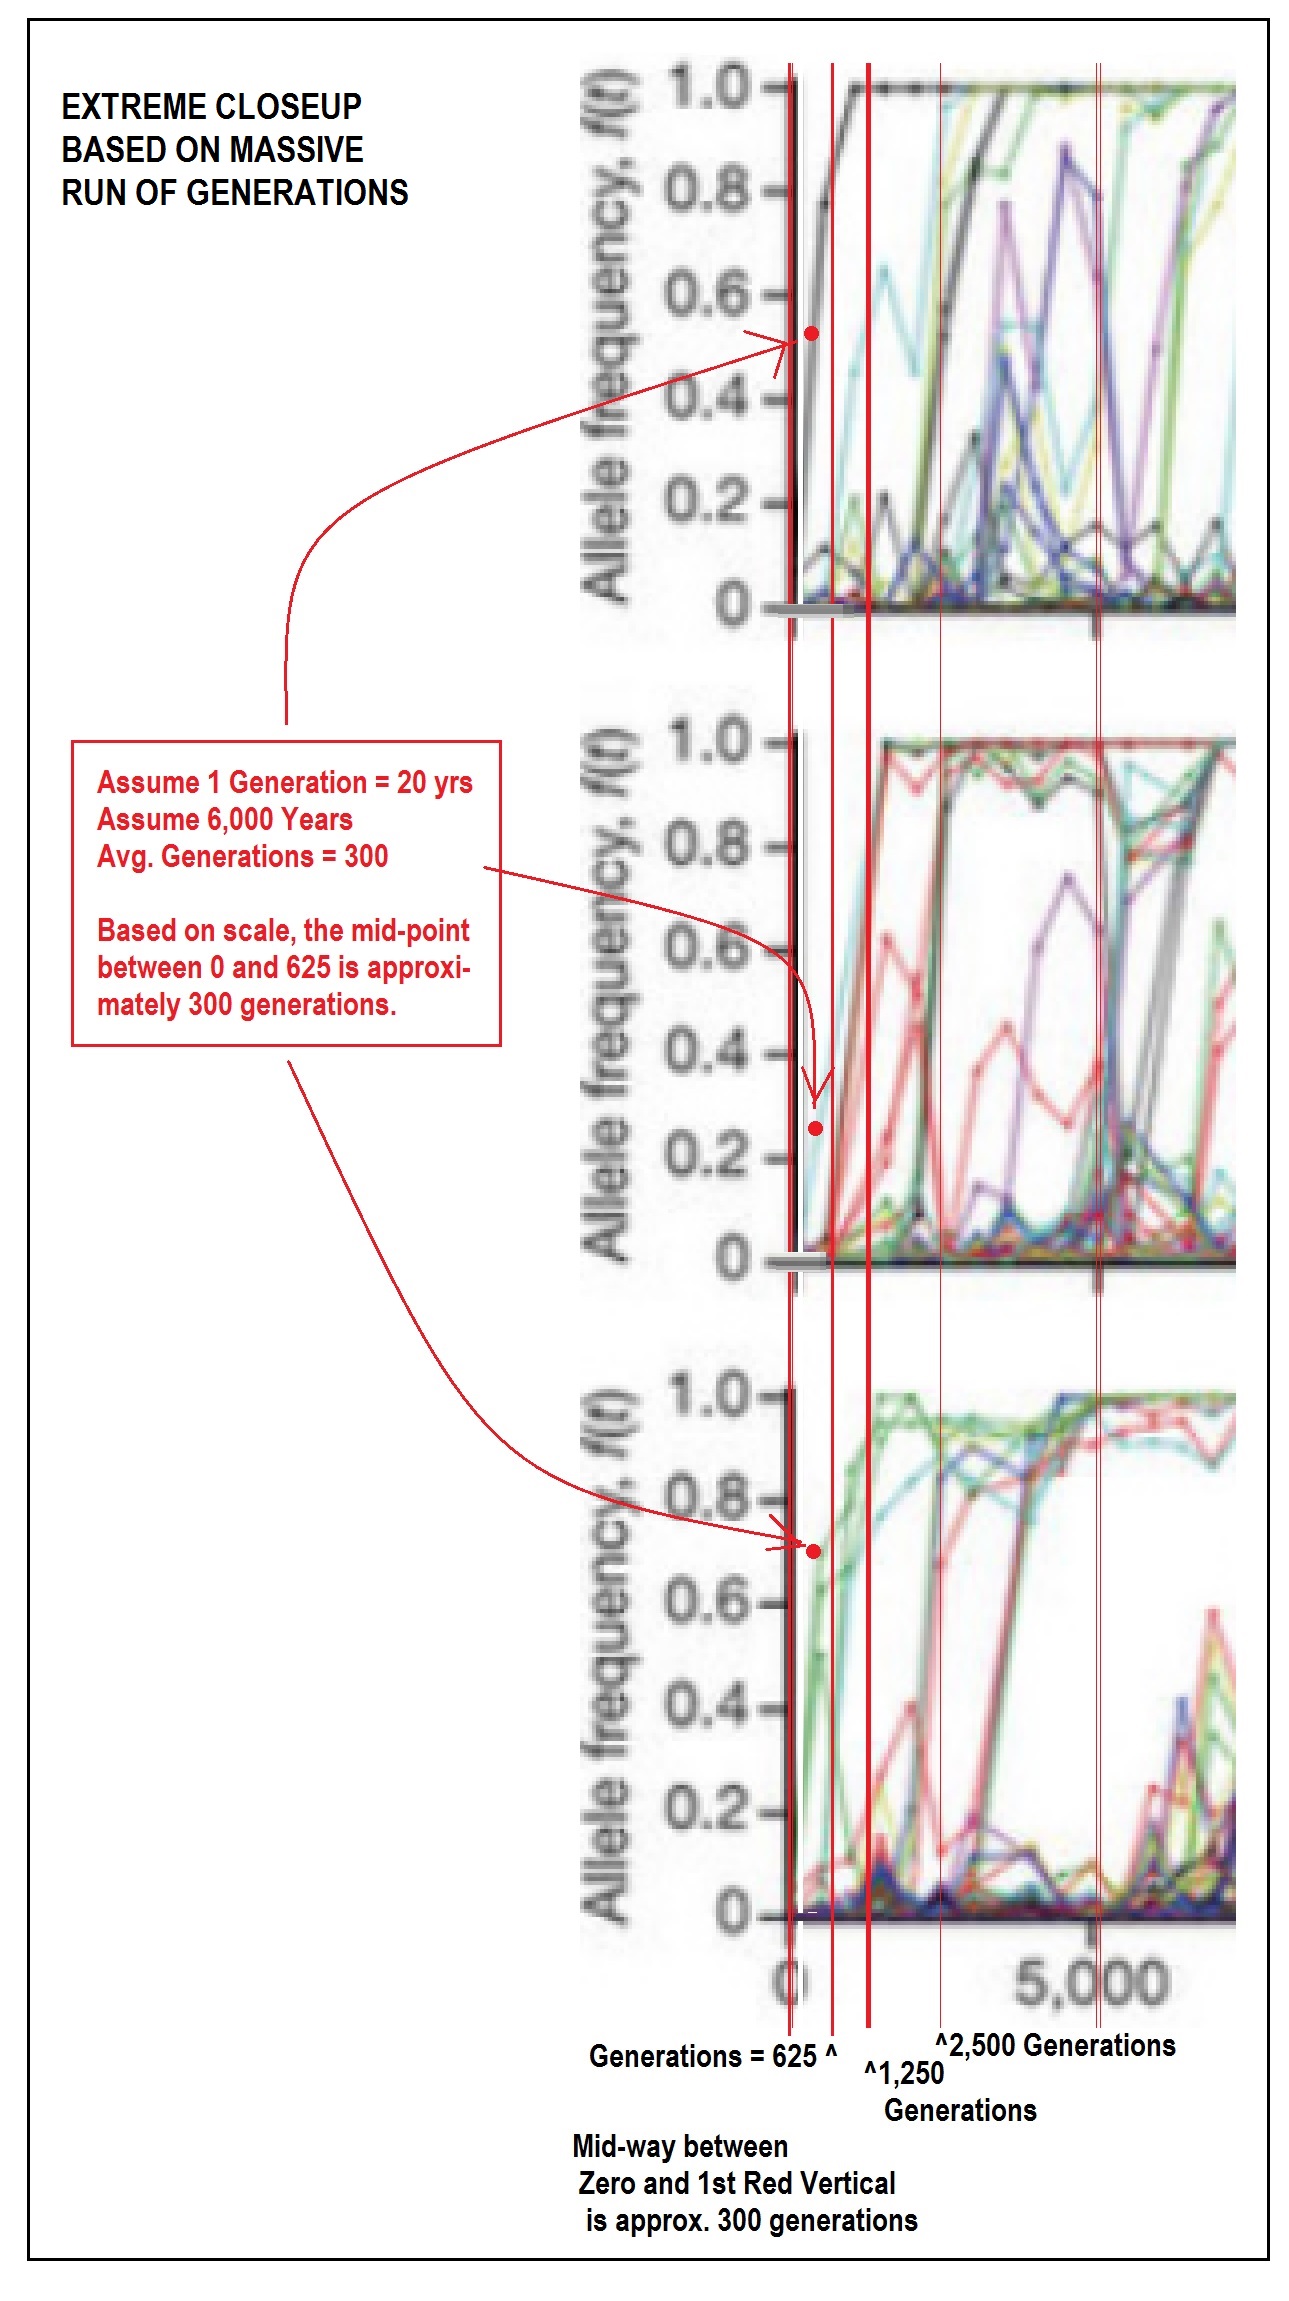
That’s a truly astonishing graphic, given the tight constraints in the Lenski experiment.
Those are impressive numbers! And now we actually have a baseline for more fulsome future discussions when someone inevitably asks “Have we tried to demonstrate evolution in a laboratory.”
But there are those amongst us who are interested in how this labor demonstration applies to a 6,000 year time frame.
So I thought I would take the scale of the three sample results, and “zoom in” as required.
Taking the first 5000 generations as my starting point (and to provide context), I then made an approximate division of the 5000 generations in two, indicating where 2,500 generations would end.
I then divided 2,500 in half, to show where 1,250 generations would end. This was followed by another division in half, showing the end of 625 generations.
If we use the aggressive number of 20 years to a generation, 6,000 years would translate into about 300 generations. So rather than insert yet another confusing red line, I placed a bold red dot “in the middle” of the Zero-to-625 generations area of each chart.
I wonder if anyone would care to comment what these three samples can tell us about a proxy for 6,000 years, or 300 generations, as the time scale of the genetic experiment?
Readers, be sure to click on the image to see it at it’s largest magnification!
Thanks Richard; you have provided a great deal of information and it will take me some time to digest it.
I will respond in a general way at this time (note I am not questioning any technical aspect, or making any criticism of the modelling approache (s)). My interest is in “imagining” how a population of species that appear to be dispersed in a large area would somehow come together to form a relatively stable population, and then from there undergo further modification to form a bottleneck that may indicate a shrinking number. (at least that is how I envisage the modelling - a population that causes a mixing leading to genetic diversity) and followed by a bottleneck that leads to new genetically relevant species. I wish I can make the comment clear, but I cannot.
Is the proposed bottleneck (whatever its size) a result of hunters forming communities of thousands, to be followed by some type of shrinking? Is a bottleneck a devise required by models of one sort or another? Or am I asking the wrong questions?
“All models are wrong, but some are useful.”
My original point was about how accurate population genetics is over prolonged periods (and how it could be verified). Approximations or neglected factors in models can tend (one hopes) to be self correcting over time, or to lead to increasing divergence (as in uncalibrated Carbon dates), which one may have to live with if no calibration can be found. That was what I mainly had in mind.
But Lenski’s results are astonishing because they appear to show that the neglected factors “including: changes in mutation rates, periodic selection, and negative frequency dependent selection factors” seem (to me, at least) to result in a chaotic type of divergence over 60K generations.
Would that not suggest that such things cannot be factored in successfully, in order to correct the model over such timeframes, any more than additional factors would enable one to describe the weather a year ago from calculations based on the last three days weather?
I would add that this chaotic divergence is seen in Lenski’s model system, where the environment is entirely stable, reproduction asexual and the original population genetically uniform. To apply it to humans (or anything else) in the wild, one must also consider sexual (and non-random) reproduction, migration that’s far more uncertain after recent deiscoveries than this time last year (with the separation and rejoining of multiple breeding populations), known (and unknown) hybridization events, and an environment changing in entirely unknown ways.
“Certainty” seems a little hard to come by in all that. Can one even produce useful ranges of possibilities?
1 Like
Hi Jon,
I would point out that @Swamidass often provides his conclusions in terms of a range, such as 300 - 400kya. This tells me that he is taking stochastic factors into account, such as the ones Lenski mentions, in communicating his results. Trsnslating his phrasing into a number, I eould guess that the error in his estimates might be on the order of ±15%.
To acknowledge some uncertainty in the estimate does not open the door to speculation from the peanut gallery that the numbers might be off by orders of magnitude.
Moreover, if the error were substantial enough to get us from 500kya to 7kya, I am sure that a well-informed skeptic of the modeling such as @RichardBuggs would have brought that to our attention.
Your fellow member of the peanut gallery,
Chris
3 Likes
Hello All,
Going to try work through some of this in the coming days.
I do not think they assumed constant population size, but I do agree they used that word “assume” imprecisely. What they did was compute an estimate of the trees using a weak prior, which was overwhelmed by the data, by design. This is a standard approach in statistical modeling and is not correctly called an assumption.
This is important because there is no modeling of the population taking place in argweaver; its just computing trees. Contrast this with, for example, the ABC method. In the ABC method (e.g. Inferring Population Size History from Large Samples of Genome-Wide Molecular Data - An Approximate Bayesian Computation Approach) populations are explicitely modeled and assuming Ne > 10,000 would make detection of lower Ne impossible.
As I explain here: Heliocentric Certainty Against a Bottleneck of Two? - #10 by swamidass - Peaceful Science
As a prior, this is not an assumption, but a starting belief that is meant to be overridden by the data. The only way that the ArgWeaver program uses the population size is in computing this prior. Population size is neither simulated nor modeled in the program except for placing this weak prior on population size. Remember, priors are not assumptions or constraints. That is why the measured
The ArgWeaver output files tell us the strength of the prior vs. the data, and it is just about 5%. That means the model output is dominated 95% by the data, and not by the prior (as it is designed).
The prior distribution for TMR4A is at about 100 kya, but we measured the TMR4A at about 420 kya. That means the data is pulling the estimate upwards from the prior, not downwards.
This last point should end any confusion. To draw analogy, it’s like we measured the weight of widgets, with the weak starting belief that the average weight of these widgets is 200 lb. After weighing several of them, and taking the prior into account, we compute the average weight is 420 lb. The fact we used a prior could be an argument that the real average is greater than 420 lb, but that is not a plausible argument that the true average is less than 420 lb. The prior, in our case is biasing the results downwards, not upwards.
The paper is imprecise in its use of the word “assume,” but the way it is actually used in the code, it is a weak prior, not an assumption.
That means the TMR4A (and all TMRCAs) are determined primarily using the formula: D = T * R, where D is mutational distance, T is time, and R is the mutation rate. That is the key determinants of the TMR4A. The prior has only a tiny impact on this, pushing the estimated T lower (not higher) than that which the data indicates.
Of course, we could try and redo the analysis without a prior, or a weaker prior. We would not expect much to change except for the TMR4A estimate to increase.
Remember, also, as you pointed out…
So we expect high Ne, even if there was a bottleneck. This is a pretty important point. Even if the method assumed Ne is high, there is no reason to doubt the TMR4A we compute from the data. Because Ne is largely decoupled from a single generation bottleneck in the distant past.
And I appreciate you bringing the question forward. It has been fun to get to the bottom of this.
More to come when I can.
About recombination,
There are several issues tied up in this question.
- The simulated ratio of mutation rate to recombination rate has to be high to accurate in estimating ARGs, not TMRCA. That is what fig S4-S8 are showing. They find works well at u/p = 2 to 6, but not as well at u/p=1.
- They point to references that show in human data (on average) the u/p is 1 to 2, but for most of the genome (away from recombination hotspots) it is greater than 2.
- It appears they used a recombination rate of 1.15e-8 and a mutational map of ~1.25e-8 per generation. So a u/p of 1.13.
- It appears that if u/p is low, the model misses some of the recombinations.
The first point to make here is that the they determining the accuracy of the method in detecting single/individual recombination events, not in estimating TMRCA. They are not testing the accuracy in measuring global statistics (like median TMR4A).
The second point to make is that recombination events that are difficult to detect are difficult because the data fits the model pretty well one way or another. There is just not enough signal in the data to determine if the event happened, because it would look identical either way. This is a problem if we really want to know the full recombination history, however its just fine if this is not what we are after.
As an aside, a seminal paper was published in 2016 that showed many recombinations are not detectable, even in principle, from extant genetic data. So their report that detection of the recombination events is difficult is consistent with this result.
The third point is that this should not affect the TMRCA times very much, if at all. It is true that recombination events are not easy to detect. That is because in some cases the data is entirely consistent with recombination and no-recombination (if, for example, no mutations happen at a leg in the tree). There is just no evidential way to discriminate these cases, but the TMRCAs of the tree are not affected.
The clarify this last point, the recombinations that are detectable are those that will reduce the TMRCA substantially. Those that do not reduce the TMRCA are much more difficult to detect, so they are missed.
Finally, we are not relying on a single TMR4A estimate but the whole distribution. That does protect us from the problem areas (like recombination hotspots). If a relatively high portion of the TMR4A’s are off, that will not affect our median estimate very much at all. That is why we chose it that way; so it will be a robust estimate to problems like this.
Does that help make sense a bit? There are ways to improve the estimate, but this is a good estimate.
I do want to emphasize that this is just the “first word” on TMR4A. Better estimates are possible, and I expect the number will be refined, perhaps up or down. The fact that some might be able imagine refinements should not diminish our confidence in these results. We can be sure it will be something around 350 kya to 650 kya. Certainly not plausible for a bottleneck 100 kya or 6 kya, but maybe farther back.
That is right, though I am giving an expert opinion there. Some people might have more or less confidence. The key thing is that it does push the TMR4A back past 200 kya, easily. Anyone who has a problem with that would be served by producing better estimates with at least as much transparency as have I.
Hi @GJDS I am struggling to follow, and don’t know if the following is helpful or not.
Possible bottleneck hypotheses in a sexual organism are:
(1) Near extinction: a pandemic or natural disaster wipes out a population, and only one male and one female from the survivors reproduce successfully
(2) Founder event: a single couple successfully colonise a new geographical region and form a new population. Their new population does not meet the descendents of the original population again until both populations have diverged to the point that reproduction between them is impossible or very rare, or the original population has gone extinct.
(3) Sexual selection: a change in sexual preference occurs in a single family such that they find the offspring of their own parents more attractive as mates than the rest of the population, and isolation is maintained by sexual selection.
There are more variations, but I think these are the main scenarios I have seen discussed in the literature.
Hi @RichardBuggs,
Thanks, as this brings some clarity to me - from your response, I gather the modeller assumes one or more of these events has taken place, and is not claiming a specific set of data are providing the basis for his model.
Yet another assumption seems to me is made, and that is a population of a particular species has formed and interbred, and fortuitously an event or events occurs to cause a small number, or a couple, to be separate and begin to populate (ugg, I feel as if I am writing a tongue twister). These comments of mine are an attempt to find out what specific physical evidence/data is used when constructing a model or simulation.
I wish I can make my comments clear, but with my background in molecular modelling, I find it a struggle to comprehend the difference between assumptions and data in your modelling exercise.
Hello @GJDS, I am not sure what exactly you are trying to ask, but I want to humbly try to cover a few basics in hopes that something I say may spark or clarify your thoughts in a helpful manner.
A “bottleneck” is any significant reduction of a population followed by expansion. This discussion has focused specifically on the severest bottleneck possible (barring self-fertilization or asexual reproduction) of two individuals.
When speaking of a bottleneck of hundreds or thousands, it is not necessary that they all know each other or live in the same group or area: it is simply a statement that the genetic material does not have the diversity of a larger group of ancestors. Bottlenecks happen all the time and they are one of the easiest things to “see” in the data of a genome or group of genomes. We can tell that cheetahs don’t have the genetic diversity of many other species, and we infer that that must be because their population historically was reduced to a small number. This is a solid and unquestioned conclusion, even if scientists may quibble the exact numbers involved.
What you are asking for is literally evidence of absence. The bottleneck is not a group of (pre)humans so much as the absence of greater numbers of (pre)humans. As such I can’t really imagine what sort of archeological evidence would indicate anything. The physical evidence is what we can tell from the genome itself.
The distant past of humanity is far from the only question being examined through genetics. Current and recent known population histories are extensively compared with the genetic information gathered. This information is so vast that predictions need not be of future events, but as-yet-unexamined present data can be predicted, successfully and unsuccessfully.
Hope a little of this is helpful, and of course feel free to correct me if I’m getting anything wrong!
1 Like
Bottlenecks are defined by the size of the bottleneck and the number of generations. A pair of individuals is severe, but it is only being posited for a single generation. So it is not nearly the “severest possible” bottleneck, which would be a single couple for several generations.
That is the puzzle actually. If it is just a single couple for merely one generation, would it be detectable? In one sense it is severe, in another sense it is not.
1 Like
I have to ask. How could you have several generations in which each generation was a single couple? Wouldn’t the second generation be brother/sister who then have another brother/sister pair, and so on.
1 Like
If I understand your point correctly, a single couple for just one generation, is 10,000 couples going down to 1 couple, and then a return to “normal reproduction” and expansion.
Compared To:
A single couple for multiple generations … which is the “real world equivalent” of a population that starts, out of nowhere, with just one couple, and no further bottleneck.
Would you agree with that?
Hi Chris, I think it would be fair to say that the ranges that Joshua @Swamidass is calculating from the TMR4A analysis do not include the uncertainty that would come from some of the more exotic effects that are evidenced in the Lenski experiment. It would be extremely difficult to do so. There is no way (that I am aware of) that we could trace the 12 Lenski populations back to one simultaneous bottleneck based only on their current diversity. This is especially true for the populations in which mutation rates have accelerated in the past, and then slowed down again. There are limits to what is knowable from present day genetic diversity, and there are some questions we will never be able to give a certain answer to. That does not mean that Joshua’s calculations are not useful – they are very useful in that they tell us that, given a fairly standard set of simplifying assumptions, a bottleneck of two in the human lineage is a scientific possibility over 500,000 years ago. It is very interesting to know that, and it helps us to discount the idea that a bottleneck of two in the human lineage in the last 7 million years is impossible. However, despite it’s usefulness, the analysis does not tell us the true history, which may include effects that have not been accounted for. The Lenski experiment is a salutary reminder of this. I am sure that what I am saying here complements, rather than contradicts, the posts by Joshua.
2 Likes
Hi Bill, that is correct. This is done quite commonly in genetics labs. See Inbred strain - Wikipedia
1 Like
Hi Joshua, it is great to have you back in the conversation so soon, and I know this reflects the importance and interest that you attach to this discussion, and your servant-hearted attitude towards all those who are interested in this topic.
This is a very interesting point, and I can see that in some ways it may seem contradictory that I am saying that a single generation bottleneck would not give a detectable Ne of 2, but also saying that a bottleneck of two followed by exponential population growth would have a profound affect on TMR4A. Thank you for pointing that out.
I think I can hold these two points together but I am going to have to pause a bit to work out how to explain this.
I am still rather unclear on how (and indeed whether) Ramussen et al estimated Ne going back in time in their paper, and this makes it harder to think through this issue in this context.
Thank you - this is a very helpful point. My concern was that undetected recombinations would lead to higher TMRCA estimates, but your point here is a good one. I just want to take a bit of time looking at the supplementary figures again before I say more on this, but this will have to wait until tomorrow as it is getting late.
1 Like
Thanks @Lynn_Munter for taking the time to clarify some points - as you state, I am looking at basic matters to obtain an idea of what the modelling may show. My interest in this discussion is to try and “imagine” the way species eventually are thought to have become the present day humanity. By this, I mean this: for example, if some event(s) caused a rapid reduction of human-like species X to form a bottleneck, did this also caused the extinction of other “human-type” species Y, Z, etc, so that we may infer the present human population arose from this bottleneck. If so, why would other species be extinct and how would this modelling account for that. If not, why not? I understand your point on “absence of evidence”, but your modelling needs some context regarding human lineage, so if there is no-evidence for various (pre)humans, and the narrative states there must be various (pre)humans, than I suggest this may be a weakness in the model - remember, the point of all of this has been to throw doubt on Adam and Eve.
Again, if you and other are patient in considering my questions: unless we can see something relevant to our understanding of the composition of the present human population, I fail to comprehend the relevance of these matters to the debate on BioLogos regarding Adam and Eve. The alternate modelling that uses recorded data of population growth, deaths and births, migration etc., which provides a recent common ancestor of about 10,000 years appears to me to be more realistic. However, I can accept correction if you and others can demonstrate how dealing with genetic diversity would be a more powerful technique regarding the basis for the discussion.