Adam, Eve and Population Genetics: A Reply to Dr. Richard Buggs (Part 1)

Hi Richard,

Allele-based methods: 1000 genomes (including their PSMC), and understanding allele frequency distribution and mutation frequency/fixation
LD: independent of mutation frequency
"recent and sophisticated" = PSMC on single individuals (a specific case of allele methods that is somewhat distinct from the prior PSMC work)

So you’re right - it’s a summary of allele methods, including PSMC, interspersed with the discussion on LD, and then back to a special case of an allele method with the use of PSMC on single genomes. That summary doesn’t include LD. I haven’t read over that section in some time. Hopefully that clears it up.

Another thing to keep in mind is that the vast majority of scientists are not at all interested in (or likely aware of) what evangelical Christians want to “see” from their data. It wouldn’t even cross the mind of a group to publish a paper that specifically tackles the question of all humans descending uniquely from just two people. This wouldn’t even be on their radar because none of the evidence we have accumulated in the last 30+ years even remotely suggests it.

So, you’re not going to see that specifically addressed in the literature. What it takes is people who are tuned to those questions who can interpret the literature in light of those issues.

4 Likes

Hi Dennis

So you're right - it's a summary of allele methods, including PSMC, interspersed with the discussion on LD, and then back to a special case of an allele method with the use of PSMC on single genomes.
I'm sorry, but that wasn't my reading of the passage. As I say, it seems to me that the passage in italics is about a method based on allele counts, (explicitly not including PSMC). It seems to be describing the kind of study you mention in your "Part I" blog:
So, a bottleneck to two individuals would leave an enduring mark on our genomes – and one part of that mark would be a severe reduction in the number of alleles we have - down to a maximum of four alleles at any given gene. Humans, however, have a large number of alleles for many genes – famously, there are hundreds of alleles for some genes involved in immune system function. These alleles take time to generate, because the mutation rate in humans is very low. This high allele diversity is thus the first indication that we did not pass through a severe population bottleneck, but rather a relatively mild one (estimated, as we have discussed, at about 10,000 individuals by current methods).
Clearly you have a study in mind that supports the passage in italics and also this paragraph from your blog. All I am requesting is that you share the reference with me. Sorry if I am starting to sound like a broken record!

Dennis, this is exactly my point! :slight_smile:This is what my Nature Ecology and Evolution community blog is saying.

I agree it’s not on the radar, but I think we are getting ahead of ourselves if we say that none of the evidence even remotely suggests it, given that the hypothesis has not been directly tested.

This is exactly my concern with your book chapter. I think you are seeing things in the studies that are not there, as they never set out to test the bottleneck hypothesis.

So the question is: given that the scientific literature does not specifically address the question of whether or not humans have passed through a bottleneck of two, what further analyses are needed to address this question? This will take more work than just interpretation of the existing literature.

I am really glad that we seem to be finding some common ground.

1 Like

I disagree here. Even if the authors themselves do not specifically address it, the data certainly do.

This also crops up in other areas - you will not find a paper where the authors specifically address the idea that the earth is 6,000 years old, for example. Why not? Because the evidence we have doesn’t even come close to 6KYA. The data absolutely are relevant to the question.

Or to put it another way, I don’t think we need more work - I think the literature is clear. I suppose what would be most convincing to you would be to have the 1000 genomes group, or Li and Durban, etc, run a simulation to see what their PSMC results would look like on an artificial dataset that is instantaneously reduced to 2 people. I think you’d see a result that gets down at least close to Ne=2 (or 20, or 200) even if it spread that result over a longer timescale, like we see in their papers. What you’re arguing is that ~1500 and 2 are indistinguishable by their methods. I disagree. More anon.

That passage is a summary statement about allele-based methods. Why would I exclude the 1000 genomes papers (including their PSMC results)? I was primarily thinking about the 1000 genomes work when writing that section.

Hi Dennis,[quote=“DennisVenema, post:29, topic:37039”]
Even if the authors themselves do not specifically address it, the data certainly do.
[/quote]

I agree that the genomic data presented in the existing literature are relevant, and sufficient, for an analysis to address the short sharp bottleneck hypothesis. But if the authors have not done an appropriate analysis, someone else needs to. As far as I can see this has not been done. This is what I am saying in my blog.

In my blog I refer to a website that reports such a simulation, which found that PSMC could not detect sharp sudden bottlenecks. I also sketch out reasons why this is to be expected. I look forward to discussing this with you in more detail.

I am sorry Dennis, but I am not persuaded that this passage in your book is a summary statement that includes the PSMC method. With all due respects to you as author, a plain reading of your chapter, as I have spelt out in detail above, is that this passage refers to an allele counting method that you then later compare the LD and PSMC approaches with. You make a point in your chapter that allele counts, LD and PSMC independently give close to the same result - a population size of 10,000 individuals.

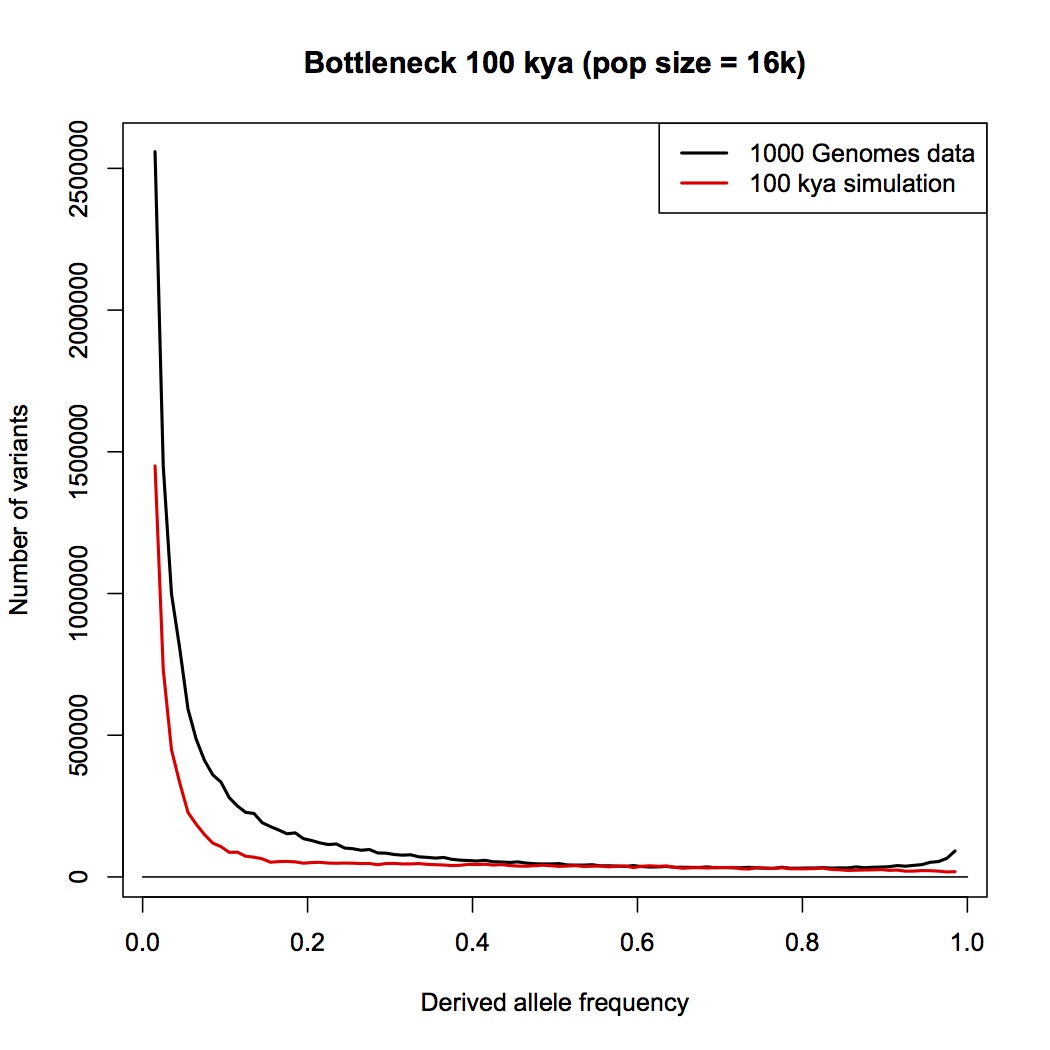
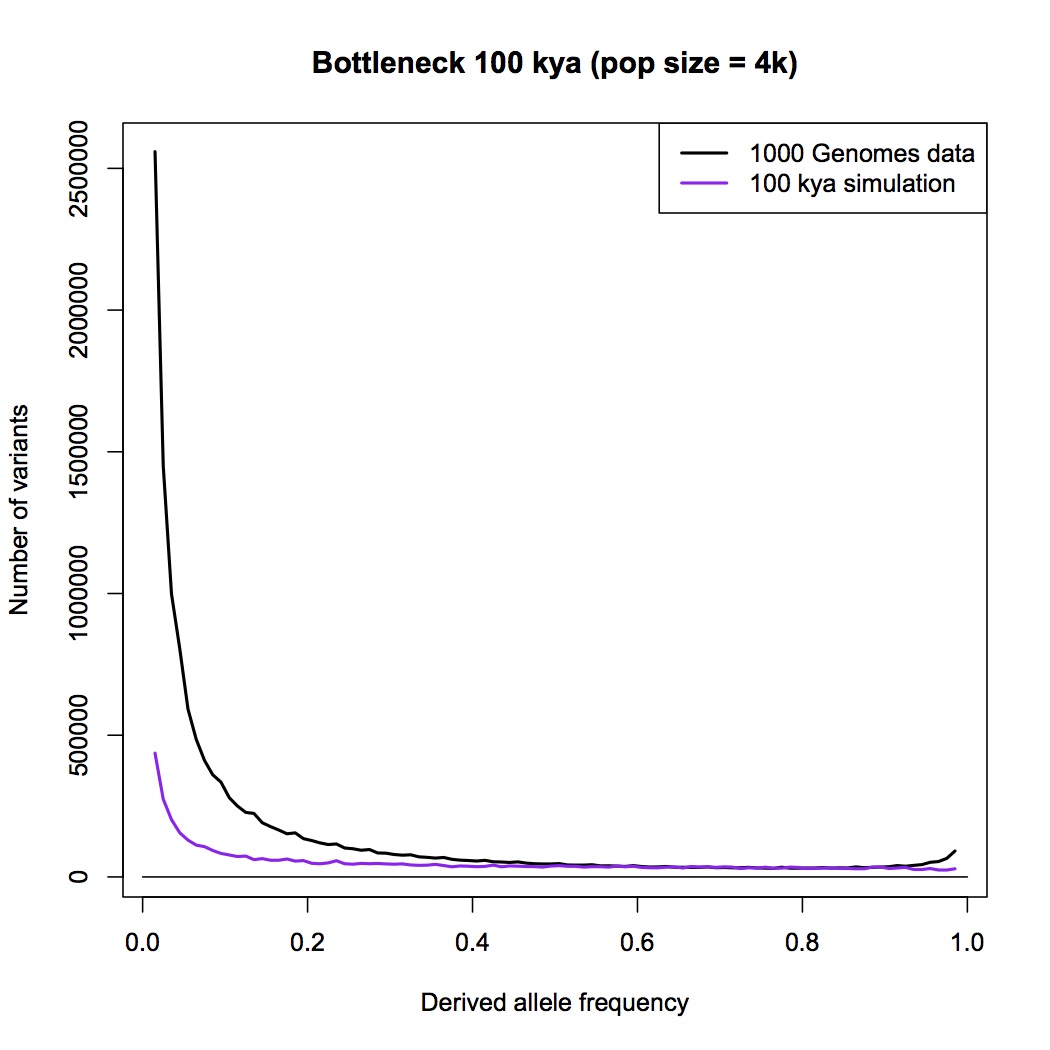
Furthermore, in your Part 1 response blog (which we are discussing here) you make a big point that heterozygosity is little affected by bottlenecks but allele counts are. You go to great length to explain why allele counts are a good way of detecting bottlenecks. You repeat the claim that the allele counting method indicates that human population sizes have never dropped below 10,000.

But now you seem to be saying to me that allele counting methods are not actually specifically included in your chapter: that the passage about the allele counting method is actually a summary about all methods that use alleles in some way, including PSMC (which does not count alleles, and does not “select a few genes”). Despite my repeated requests, you have not given me any reference or citation, or a description of an analysis that you or someone else has done, where human effective population sizes have been estimated by an allele counting method.

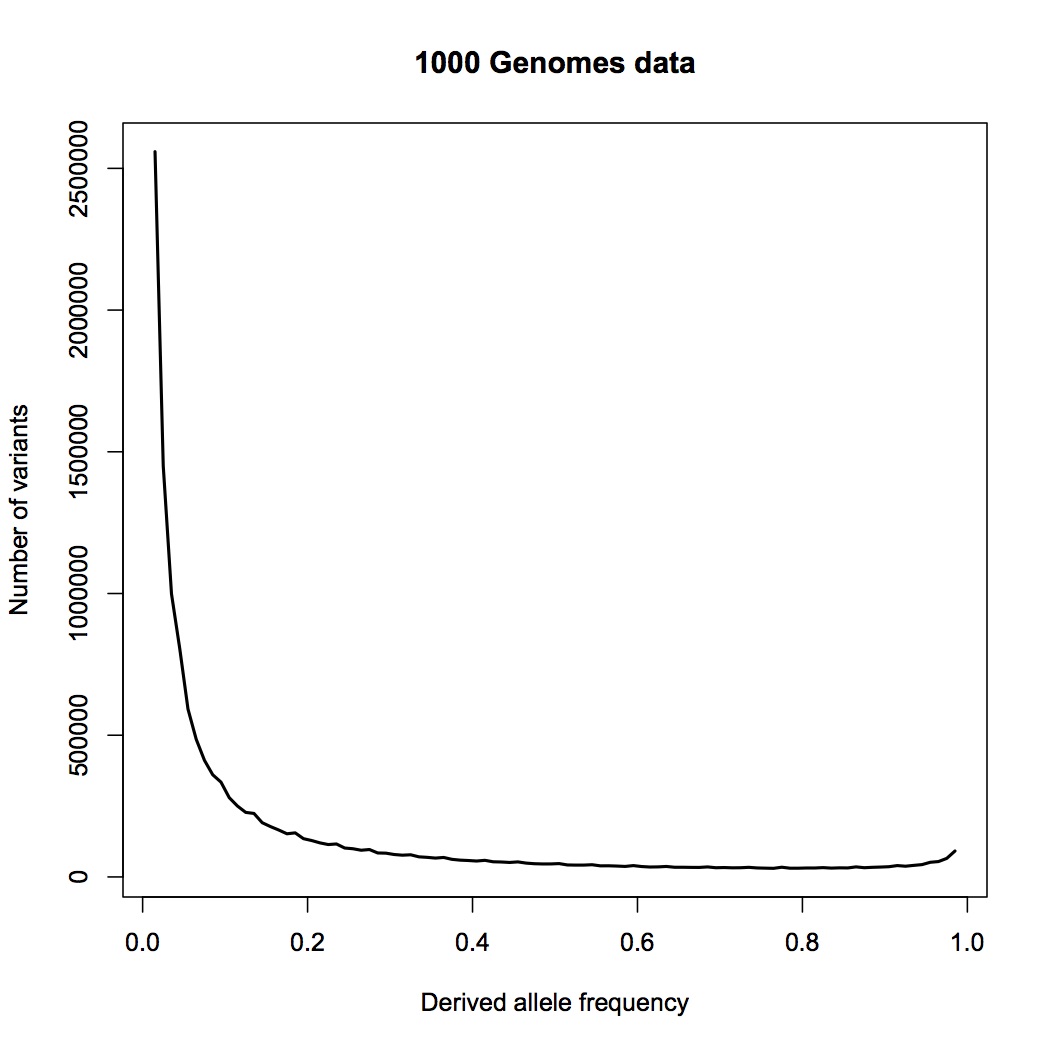
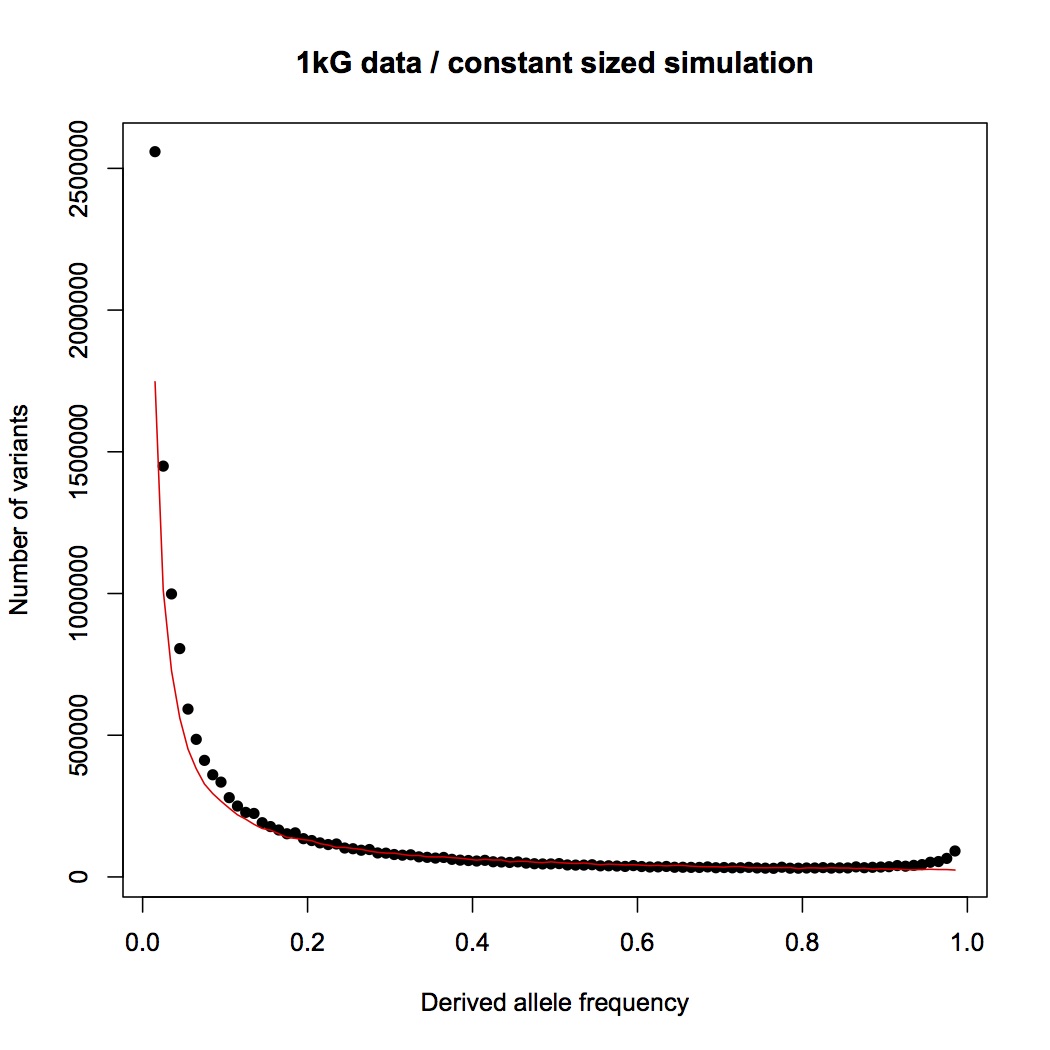
Instead, you are pointing me to the 1000 genomes paper. This is a wonderful paper that I have often referred my students to, and I do not doubt for a moment that the 1000 genomes project provides the raw data necessary for an analysis based on allele counts, but as far as I can see, the authors have not done such an analysis.

If you are not able to give me a citation that includes use of an allele counting method, why did you spend such a large proportion of your Part I blog explaining why the allele counting method is such a good way of detecting bottlenecks? Why do you mention allele counting methods in your book?

I have to admit, I am bemused by this. I think that the allele counting method is one of the best methods available for detecting bottlenecks, and I think it is the biggest challenge to the bottleneck of two hypothesis. I think there is a really interesting discussion to be had here. It has come as a genuine surprise to me that you are not pointing me to a calculation, or a paper, or a textbook, or something else that clearly explains the derivation of a 10,000 effective population size figure.

We seem to have reached an impasse on this point. I will have to let others read through your book chapter and your blog above, and reach their own conclusions.

Richard,

Perhaps you could wait for Dennis to post the next parts of his blog response, as he’s committed to do, before declaring an impasse.

2 Likes

@RichardBuggs,

Surely @DennisVenema is not the only person who can do genome mathematics.

What test or study results can you offer that would indicate an answer closer to 2 than to 10,000? Certainly on a scale of difference that large, it should be relatively easy to offer some general results from your side of the divide.

Hi Tim, I’m not saying we are at an impasse on this whole issue - just the point about what Dennis was saying in that particular, but very important passage of his book.

I would invite you to step in and help us. As far as I can see you are not a biologist, so you can help adjudicate between us about what is the plain meaning of the passage to readers. Perhaps @TedDavis could also pitch in to, as he finds Dennis’s writing to have great clarity, as he has mentioned above. As a historian, he must be used to looking closely at the meaning of texts. I would also welcome the view of @glipsnort as a geneticist, and perhaps @Christy could step in as moderator. I would also welcome other readers to pitch in and give their opinion.

The questions I ask you are, when you read the extract from Adam and the Genome in bold below, which I show in its context:

  • Does the passage make you think that it is referring to a scientific study where a few genes have been selected and the number of alleles of those genes in current day human populations have been measured?

  • Does the passage make you think that someone has done calculations on these genes on a computer that have indicated that the ancestral population size for humans is around 10,000?

  • Does the passage make you think that this is a different method to the PSMC method?

Here is the passage that we are discussing in its context in Adam and the Genome:

...given the importance of this question for many Christians— and the strong insistence of many apologists that the science is completely wrong— it is worth at least sketching out a few of the methods geneticists use that support the conclusion that we descend from a population that has never dipped below about 10,000 individuals. While the story of the beleaguered Tasmanian devil provides a nice way to “see” the sort of thing we would expect if in fact the human race began with just two individuals, scientists have many other methods at their disposal to measure just how large our population has been over time. One simple way is to select a few genes and measure how many alleles of that gene are present in present-day humans. Now that the Human Genome Project has been completed and we have sequenced the DNA of thousands of humans, this sort of study can be done simply using a computer. Taking into account the human mutation rate, and the mathematical probability of new mutations spreading in a population or being lost, these methods indicate an ancestral population size for humans right around that 10,000 figure. In fact, to generate the number of alleles we see in the present day from a starting point of just two individuals, one would have to postulate mutation rates far in excess of what we observe for any animal. Ah, you might say, these studies require an estimate of mutation frequencies from the distant past. What if the mutation frequency once was much higher than it is now? Couldn’t that explain the data we see now and still preserve an original founding couple? Aside from the problems this sort of mutation rate would present to any species, we have other ways of measuring ancestral population sizes that do not depend on mutation frequency. These methods thus provide an independent way to check our results using allele diversity alone. Let’s tackle one of these methods next: estimating ancestral population sizes using something known as “linkage disequilibrium.” [Then, the text describes the LD study and continues]...The results indicate that we come from an ancestral population of about 10,000 individuals— the same result we obtained when using allele diversity alone... [Then a little later the chapter continues] A more recent and sophisticated model that uses a similar approach but also incorporates mutation frequency has recently been published. This paper was significant because the model allows for determining ancestral population sizes over time using the genome of only one individual. [It then describes the PSMC method, saying of it]... Instead of looking at a given pair of loci in many individuals, this method looks at many pairs of loci within one individual....this is in good agreement with previous, less powerful methods,
I look forward to your and other readers' answers to my questions.
1 Like

Time for me to comment. I’ll break this up into pieces, and starting with prior thinking on the subject.

The hypothesis is that there was a bottleneck of size two in the immediate human lineage. For me, the plausibility of the hypothesis (i.e. whether it is one I would think likely enough to be worth investigating) depends critically on the timing of the bottleneck. Here’s how I think about it:

  1. Population bottlenecks distort the allele frequency distribution in the bottlenecked population. A bottleneck of size two massively distorts it. It takes time for that distortion to be erased by genetic drift.
  2. The characteristic timescale (in generations) for genetic drift in diploids is twice the effective population size.
  3. Human populations from Africa show allele frequency distributions that are broadly consistent with a constant population size plus relatively recent expansion.
  4. The relevant effective population size for humans is roughly 10,000. (Probably higher, actually, given current estimates of the mutation rate.)
  5. Human generation time is roughly 25 years. (Again, recent estimates put it higher.)

From these facts, my working assumption is that this kind of bottleneck would be detectable for at least ~500,000 years, and that such a tight bottleneck within the last 250,000 years would leave the kind of evidence that researchers would have seen just by looking at allele frequency data.

That’s my intuition. Testing that intuition requires some work, which I will attempt to describe after my malaria genetics meeting.

7 Likes

I don’t have a copy of the book in front of me, but I don’t have any reason to think the blocked text is not accurately quoted and edited.

So, my answer to each of your three questions is, Yes.

I am indeed a true ignoramus on these issues, having never studied any biology after one year in high school roughly fifty years ago. My science degree was in physics, and my research lab experience in astrophysics, and none of it at all recent. Nearly all of the science in Dennis’ book and in this thread is totally unfamiliar to me. My only point of contact is that I did read Ayala’s 1994 paper a few years ago, and I understood the takeaway message about a group of ancestors ca. 10,000 much further back than 6000 years. I can’t tell you how he and his team got there, and I can’t tell you what the PSMC method is. Like almost everyone else reading this, I don’t know what I’m talking about, when it comes to the science. All I can say is that no one in this discussion appears to have made an argument that violates a fundamental physical law. :slight_smile:

I appreciate you coming into this conversation, Dr Buggs and Dr Schaffner. Dennis already devotes a lot of time to helping people like me understand biology, but I wish more biologists would do that. I realize that the demands of running a research laboratory effectively preclude that type of activity as regular thing, and one’s peers tend to frown on it. Ditto in the humanities. IMO, however, experts in any field have no right to complain about the dismal state of popular knowledge about their field, if they haven’t tried to address it themselves–or, at least, if they haven’t properly supported those colleagues who do make the effort.

8 Likes

Richard,

As far as I can tell, Dennis makes three claims most relevant to your point: One, that there is a method to estimate minimum ancestral population sizes based upon measurements of number of alleles across various genes present in a population, and that this method indicates a population of approx. 10,000. Two, that an independent method exists that does not rely upon estimates of past mutation rates, involving “linkage disequilibrium,” that converges upon the same ancestral population size of 10,000. Three, that there has been a more recent method that is similar (not identical) that is not independent of mutation rate but also converges on similar results, namely the PSMC method.

Of these three approaches, Dennis’s support for the first seems to derive mostly from calculations on collected data. Presumably done by himself or others. Of the latter two approaches, that does seem to be something that is published and to which he could (and I think did) direct you. But I’m unclear as to whether the published studies for the latter two methods explicitly state Dennis’s conclusions or if he is drawing as well primarily on their collected data for support. I’m perhaps at a bit of a handicap on this as I’m relying on only excerpts of his book here on this thread. But to your point I do believe he describes three distinct methods. I’m eager to hear more about the sort of calculations conducted in these methods and how they may or may not support Dennis’s argument. That is what I am looking forward to in his remaining parts to this topic.

First, the data. Here is the allele frequency distribution for the combined African population in 1000 Genomes Project data:


This includes all single-base variant sites from the 22 autosomes that have exactly two alleles in the data, i.e. some people have an A at one site, while others have a T there, and no third variant is found. I have only taken sites with a minor allele frequency greater than 1%. I estimate the effective size of the genome being assayed here to be 2.4 billion base pairs.

The frequency on the x axis is that of the derived allele, i.e. the base that is different from the ancestral state, as inferred from primate relatives. Theoretically, this distribution falls as 1/frequency for an ideal, constant-sized population. New variants appear when a mutation occurs, and initially appear as a single copy, which means an allele frequency of 1/2N, where N is the population size. (It’s 2N because each person has two copies of the genome.) The frequency will then wander randomly from generation to generation (“genetic drift”), and in some cases will eventually wander to high values.

The rise near the right edge results primarily from misidentification of the ancestral allele (for ~2% of sites); the true frequency for many of those sites is one minus the frequency shown. The little jiggles along the curve are artifacts from binning, not noise – there is a lot of data here, and very little statistical uncertainty.

Here is the same data (black) compared to the prediction for a population with constant size (red):


The observed distribution follows the prediction very well above 20% frequency, and is higher than predicted as lower frequencies, which is indicative of fairly recent population expansion. I made the predicted curve with a forward simulation (for those who know about genetic simulators), previously published, using an effective population size of 16,384 and a mutation rate (1.6e-8/bp/generation) drawn from David Reich’s recent study (here). I chose the mutation rate to be conservative, since it is the highest recently published estimate that I know of. (The lower the mutation rate, the longer it takes to generate the diversity lost through a bottleneck, and the easier it is to detect the bottleneck.) I chose the population size because it’s a power of two (convenient for when I start modeling the bottleneck) and in the right ballpark for humans. The chosen population size and mutation rate happen to give a predicted curve that’s pretty much bang on the empirical data, without any tuning needed.

So. . . the point of this exercise will be to determine whether a model with a recent bottleneck of size two can reproduce the data distribution. Comparisons in next post.

5 Likes

Bottleneck simulations:
I modeled the Adam and Eve bottleneck as a constant-sized population, followed by a sudden collapse to 2 individuals, after which the population doubles every generation until it reaches a new, fixed value. I assume 25 years per generation. Here is the resulting frequency distribution for a bottleneck 100,000 years ago, with a final population size of 16,384:

The two dotted lines show the contribution from genetic variation that survived the bottleneck (red) and from mutations occurring after the bottleneck (green). The distribution for pre-bottleneck variation, which would have had the characteristic 1/frequency appearance originally, is nearly flat after going through the bottleneck; that’s what I mean by a massive distortion of the spectrum. That’s also why it’s not really relevant that a lot of heterozygosity makes it through a bottleneck: the bottleneck still has dramatic effects on diversity.

The contributions from before and after the bottleneck are effectively independent. This means I can increase the pre-b contribution by increasing the original population size, pretty much however is needed to agree with the data. For future comparisons with data, then, I will scale ancestral population as needed to match the data in the 60-70% frequency range.

Here is how this particular model compares to the empirical data we’ve already seen:


It might not look too bad at a glance, but the agreement here is terrible in the region of interest. In places, there are more than three times as many variants as predicted. There simply has not been enough time for mutation to generate new variation, and for genetic drift to increase their frequency substantially. I know of no biologically plausible process that would make this model work. A smaller post-bottleneck population has more drift, so the peak gets smeared out more, but also has half as many variants. Here’s what the same simulation looks like with a post-bottleneck population of 4000:

(More comparisons in a bit, after I go back and edit my last post.)

5 Likes

Based on the previous results, Adam and Eve (as a unique pair of ancestors) are simply not credible within the last 100,000 years. Not at all. How about longer ago? My intuition was that anything in the last 250,000 years would be easy to rule out – so that’s what I modeled.

Here is the comparison for a 250,000 year old bottleneck, with the usual population size of ~16,000:

We’re getting a lot closer, but we’re still not there. There are still around twice as many observed variant sites as predicted in places, since there still hasn’t been time to fill out the depleted part of the distribution. Much larger or smaller final populations make things even worse.

Based on allele frequencies, then, 250,000 years seems to be too recent for a two-person bottleneck, even just judging the distributions by eye. For even earlier dates, I would want to use more rigorous statistical tests, which should also be more sensitive. Exactly how far back you can exclude a single couple gets murky and would require a lot of study, which is why I usually give “several hundred thousand years” as the likely excluded region.

Questions are welcome.

6 Likes

Hi Steve. Thanks for doing this. Can you show what 500,000 or 1 million look like, or is that too computationally intensive?

Ann

2 Likes

This question is simply out of curiosity and not questioning the nature of the simulation (I have downloaded a couple of papers).

Are your simulations based solely on data on current population(s), or do you have data that directly addresses past populations as well?

Here’s 500,000 years; I’m running 1 million now. To approximate a constant-sized initial population, I simulate a pop of 10,000 for 100,000 generations to start each simulation, so a million years at 16k pop size isn’t much of a computational burden.

As you move the bottleneck date earlier, I start to worry that more complex demographies really should be explored for a better fit. Something like a pop size of 30,000 after the bottleneck for 250,000 years, a second, modest bottleneck, then another 250,000 at 30,000 might be a way to generate lots of mutations and still get enough drift to shift them to higher frequencies. But I don’t want to undertake this as a research project.

2 Likes