First, the data. Here is the allele frequency distribution for the combined African population in 1000 Genomes Project data:
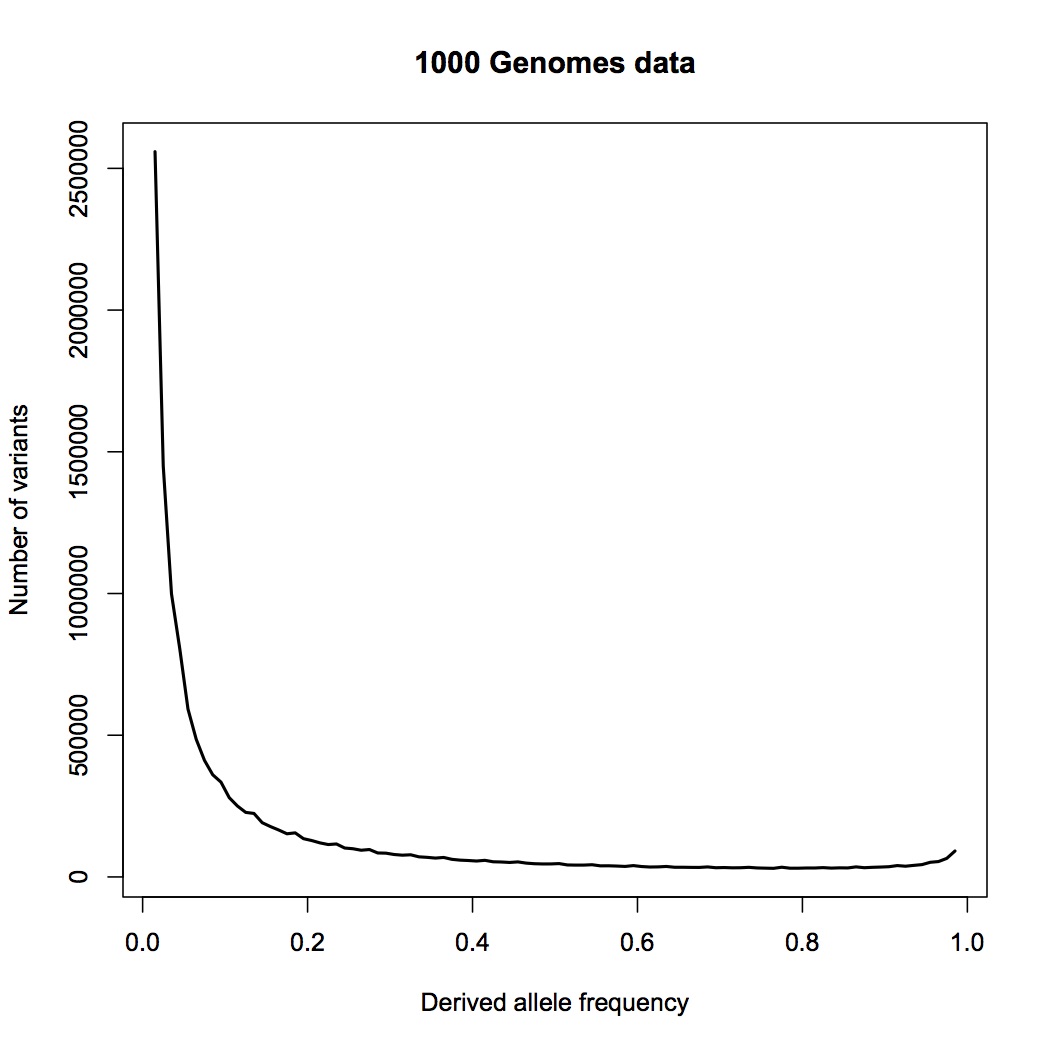
This includes all single-base variant sites from the 22 autosomes that have exactly two alleles in the data, i.e. some people have an A at one site, while others have a T there, and no third variant is found. I have only taken sites with a minor allele frequency greater than 1%. I estimate the effective size of the genome being assayed here to be 2.4 billion base pairs.
The frequency on the x axis is that of the derived allele, i.e. the base that is different from the ancestral state, as inferred from primate relatives. Theoretically, this distribution falls as 1/frequency for an ideal, constant-sized population. New variants appear when a mutation occurs, and initially appear as a single copy, which means an allele frequency of 1/2N, where N is the population size. (It’s 2N because each person has two copies of the genome.) The frequency will then wander randomly from generation to generation (“genetic drift”), and in some cases will eventually wander to high values.
The rise near the right edge results primarily from misidentification of the ancestral allele (for ~2% of sites); the true frequency for many of those sites is one minus the frequency shown. The little jiggles along the curve are artifacts from binning, not noise – there is a lot of data here, and very little statistical uncertainty.
Here is the same data (black) compared to the prediction for a population with constant size (red):
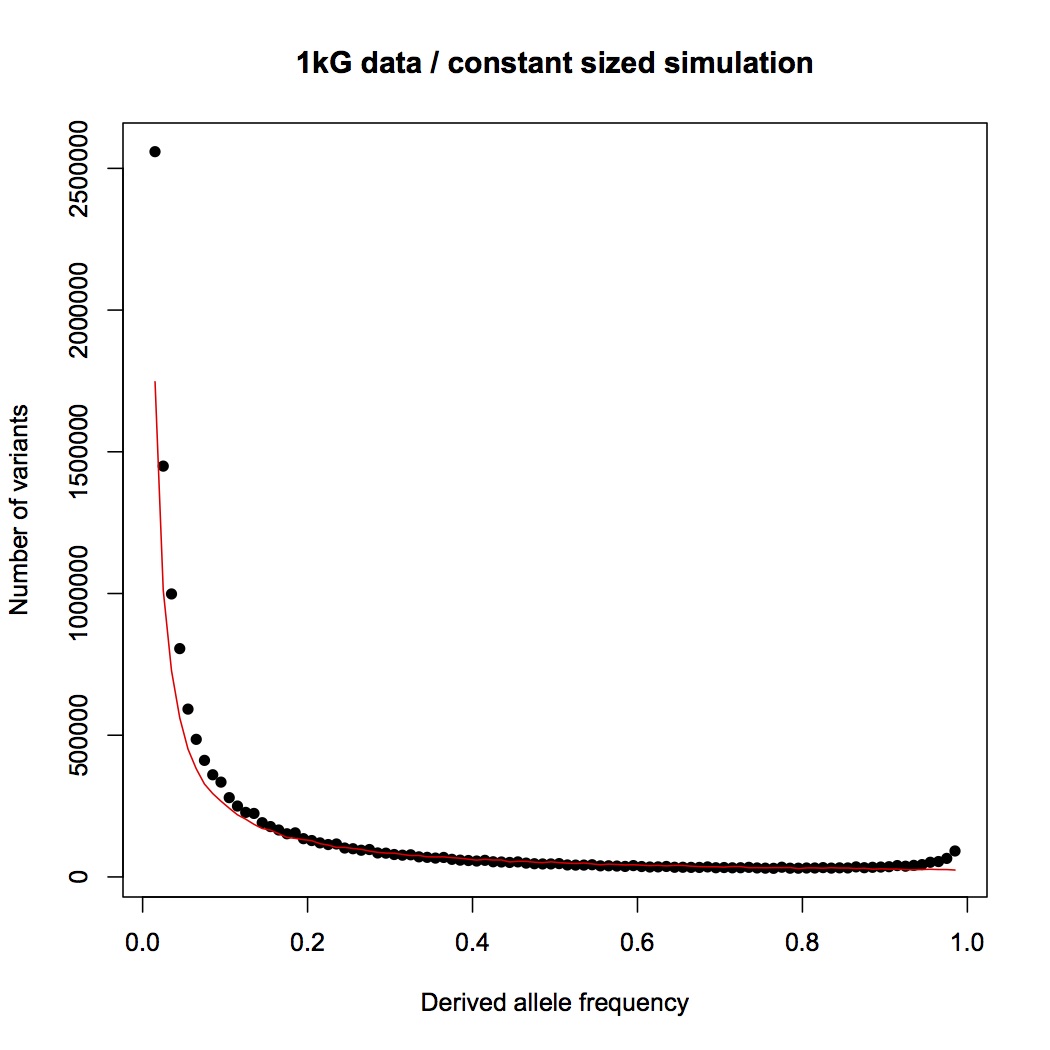
The observed distribution follows the prediction very well above 20% frequency, and is higher than predicted as lower frequencies, which is indicative of fairly recent population expansion. I made the predicted curve with a forward simulation (for those who know about genetic simulators), previously published, using an effective population size of 16,384 and a mutation rate (1.6e-8/bp/generation) drawn from David Reich’s recent study (here). I chose the mutation rate to be conservative, since it is the highest recently published estimate that I know of. (The lower the mutation rate, the longer it takes to generate the diversity lost through a bottleneck, and the easier it is to detect the bottleneck.) I chose the population size because it’s a power of two (convenient for when I start modeling the bottleneck) and in the right ballpark for humans. The chosen population size and mutation rate happen to give a predicted curve that’s pretty much bang on the empirical data, without any tuning needed.
So. . . the point of this exercise will be to determine whether a model with a recent bottleneck of size two can reproduce the data distribution. Comparisons in next post.