I love you, Eric. I am encouraging you to step up your game by posing important questions. I would not have asked if I did not think you are up to the task!
Peace,
Chris
I love you, Eric. I am encouraging you to step up your game by posing important questions. I would not have asked if I did not think you are up to the task!
Peace,
Chris
“Science” is not some single activity that will be captured by one task or activity. Trying to falsify stuff is a very important part of science - and it is precisely because of all the attempted falsification (and actual falsification of certain aspects of of the theory - causing weak parts of it to be culled away) that is exactly what has made what remains so strong. But that is one part of science. Another part is when scientists use that theory and its strengths to help direct further inquiry … “to run with it” in other words and see where else it might lead. And when it leads in fruitful directions, that too is part of science. There comes a time when our investigative efforts take some things for granted (like the roundness of the earth) and use the settled knowledge as a basis for pursuing other things. If the settled knowledge proves to be problematic at its very core, it will not long remain a basis for much exploration without showing that something is wrong. Biological evolution (common descent) has been a fruitful basis of inquiry for quite a long time by now.
“I’m just a poor boy  , I need no sympathy
  .” - Queen (with Freddie Mercury)
There was a color change (light to dark) in the mouse population that lived on the dark area (the lava flow). It’s easier for dark mice to hide from visual predators when they live on a dark area, right? Genetic analysis was done to see what might account for this change. The scientist, Michael Nachman , seems to have great credentials, right?
What should he have done differently?
btw, this was just a short film to teach high school kids about evolution. BioInteractive also provides other free related resources and activities that go with this film. What to learn more?
Here’s a pic and link to the paper:
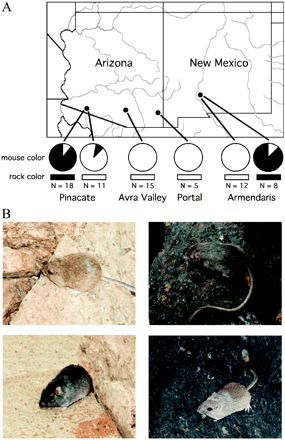
( A ) Collecting localities, substrate color, and mouse color. Sample sizes at each site are given. Pie charts indicate the proportion of light and dark mice at each site. Rectangles indicate the substrate color at each site. Mice from Pinacate and Armendaris were sampled on dark lava and also on light rock adjacent to the lava, whereas mice from Avra Valley and Portal were sampled only on light rock. ( B ) Light and dark C. intermedius from the Pinacate locality on light and dark rocks.
https://www.pnas.org/content/100/9/5268
I did link to the scientist’s web site, but you have made my post even better with the details and background! Was it in vain? We shall see. I do know that people on this site value input from males.
Thanks so much!
That would be incorrect because they did test for natural selection. That is why they mapped the distribution of the phenotype with respect to the color of the background substrate. They found a strong positive correlation between coat color and the color of the rocks in the area. This was further tested using population studies. With the use of mitochondrial genomes (if memory serves), they were able to show that there was free interbreeding between the mouse populations on the black rocks and light brown rocks. Even though the black coat color phenotype was dominant they were not able to find as many with the phenotype in the light brown desert close to the black rocks. This is what you would expect to see if there was selective pressure on coat color based on camouflage.
The paper also discusses the specific genetic mutations that confer black coat color in one of the populations. Interestingly, mutations in the homolog of the mouse gene are known to control human skin color.
Your link is great, I easily found the original paper. I will note I am the only person who ‘hearted’ your link too ![]()
Well, thanks for that.
I will grant you that Mickey Mouse was intelligently designed…
I concluded I could reproduce your mutation pattern. However, I still needed to run actual tests for randomness to be able to say the mutations are actually random.
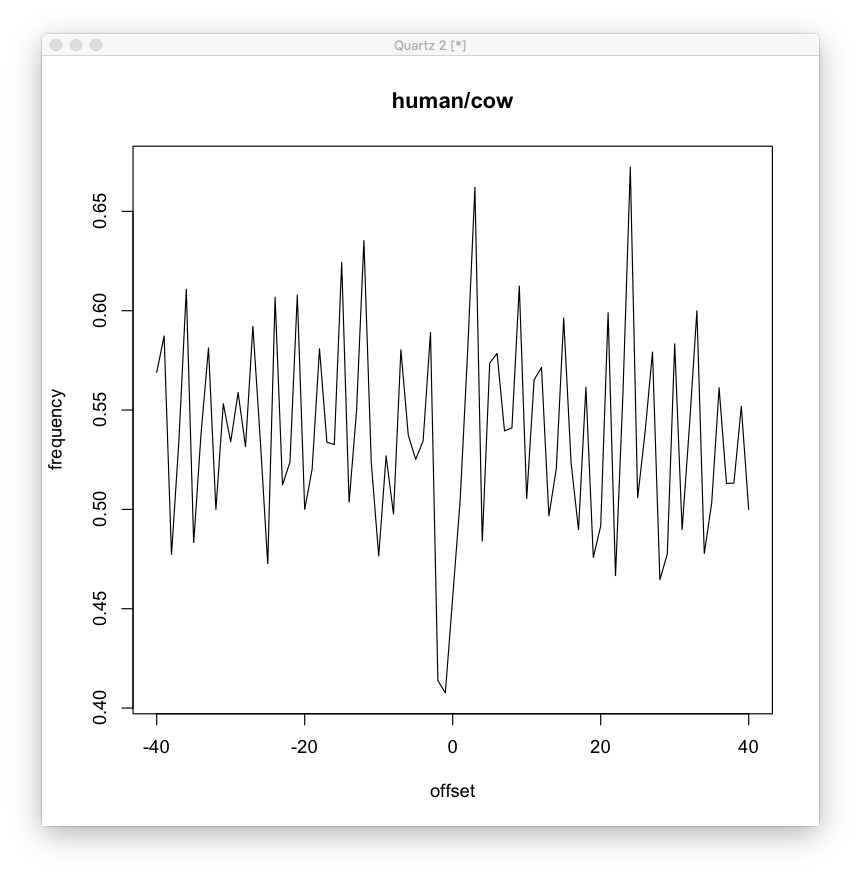
Some results from my mtDNA dataset. Here’s a local pattern in human/cow. The g<->a and t<->c mutation frequencies are controlled by the distance from the ‘g’ character in a strange oscillating pattern.
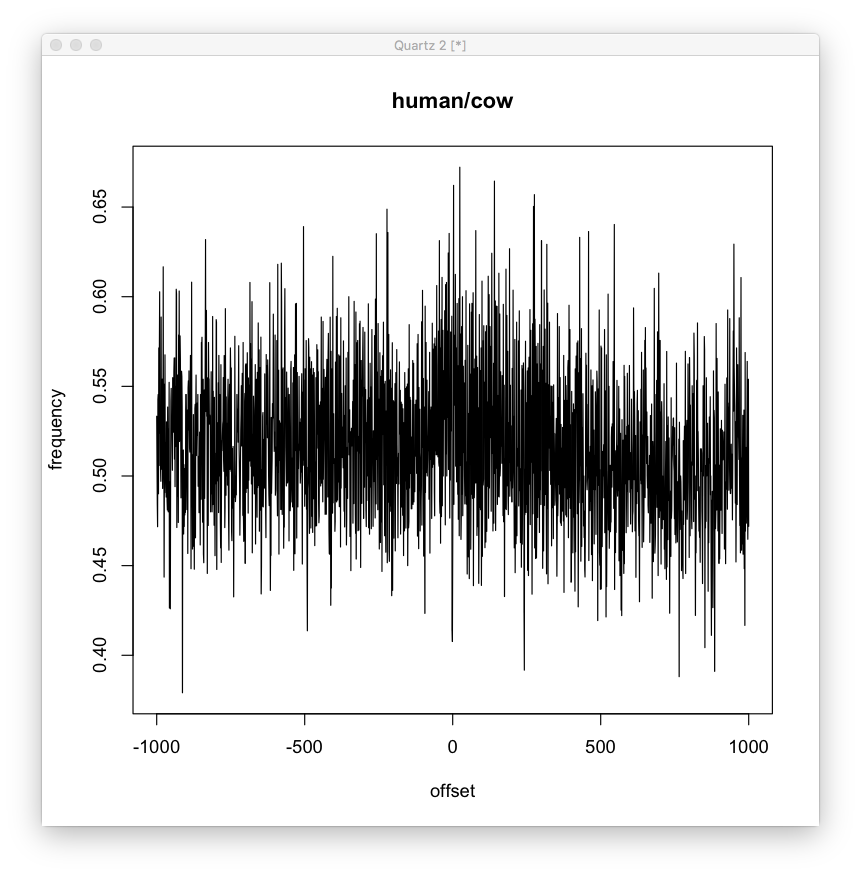
Here’s a global pattern for the g<->a and t<->c mutations, also in human/cow.
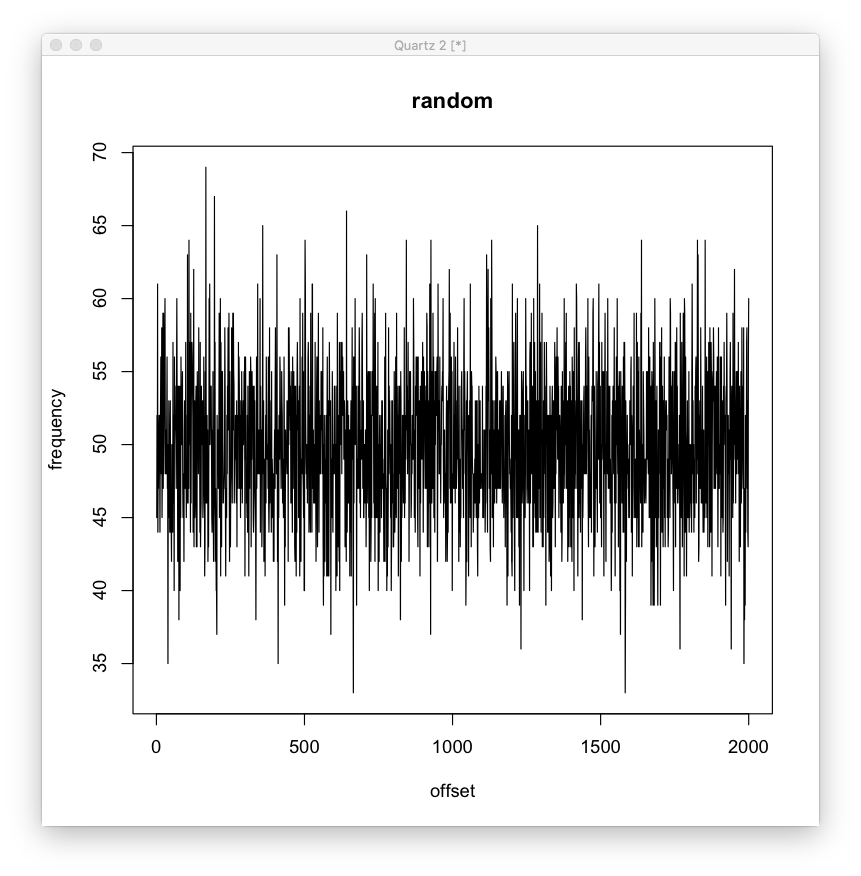
Compared to random. Not a super clear difference, but it doesn’t seem non existent.
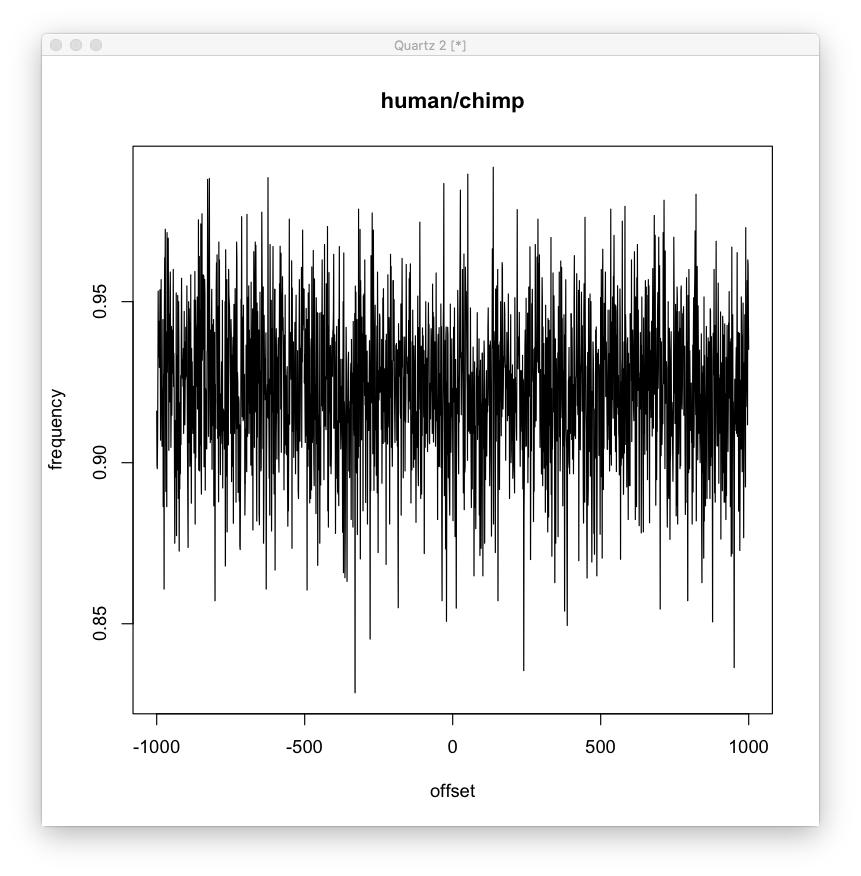
Also, compared to human/chimp, where the difference is more likely to be due to random mutation. We can see this looks more like the random graph (though still different, look at the variance, mean and skew).
So, I think it is premature to conclude from your study that mutations are random, even if they follow the biochemistry distribution.
Another weird thing, I read humans and chimps should only be 2% different in their DNA.
However, when I look at the genome stats at NCBI
I see there is a 6% size difference between the genomes, and humans have 61,165 genes while chimps have 39,600 genes. That seems much bigger than 2%. I’m not sure where the 2% number comes from. If we go off of just gene counts there is a 35% difference between the two, and thats assuming all genes match!
I have no idea how you could conclude anything at all from what you just did.
They differ in homologous sequence by 1.2% single-base substitutions. Each genome has ~1.5% of unique sequence due to small insertions and deletions. There’s another ~3% that’s been subjected to recent large-scale duplication in one or both.
NCBI is not attempting to estimate the actual sizes of the genomes – those are the sizes of the assemblies, which include more or less arbitrarily sized chunks of unassembled genome.
Comparing gene annotation sets will not tell you anything at all, except perhaps which has had more work put into annotation. Each genome has roughly 20,000 protein-coding genes, as it happens.
The plots don’t look like they are sampled from a normal distribution. If they are random, then comparison to an offset character should produce no statistically significant pattern, i.e. should look like a normal distribution.
Thanks for the chimp human info. It is still mysterious why we can be so confident in this 1-2% number. Additionally, I saw on NCBI the chimp assembly uses the human genome as a reference. How can they be sure the small difference is not due to using human as reference? Also, I read the difference is based on homologous sections, so they are only looking at sections that are already similar. Are there any sections without known homologs? How big are these sections? It just seems bizarre to me, like the conclusion is baked into the premises. How is this good, well controlled science?
It is also strange the gene annotation numbers should be so different. I would think if the genomes are so similar, it would be a simple matter to find the same gene in each genome. I will also need to find the lists of the 20k protein coding genes to see how much overlap there is.
You would need to establish what you mean by random, and what biologists mean by random. From my understanding of the literature, biologists are referring to random with respect to fitness as defined by experiments like the fluctuation assay and the plate replica assay:
Both of those experiments demonstrated the randomness of mutations with respect to fitness, and they did so before the structure of DNA was even known. If there are mutational hotspots this does nothing to change the conclusion of random mutations since it was never about the physical distribution of mutations.
From what I read at the Genome News Network, it looks like your 98% similarity between chimps and ourselves is low. Given what Steve said in answer to you, it looks like a rounding error.
The more closely related two people are, the more similar their genomes. Scientists estimate that the genomes of non-related people—any two people plucked at random off the street—differ at about 1 in every 1,200 to 1,500 DNA bases, or “letters.” Whether that’s a little or a lot of variation depends on your perspective. There are more than three million differences between your genome and anyone else’s. On the other hand, we are all 99.9 percent the same, DNA-wise. (By contrast, we are only about 99 percent the same as our closest relatives, chimpanzees.)
Admittedly I cannot tell you how those numbers are derived.
I’m sure there are some tweaks that still need to be done, but it should only result in minor changes in the overall accuracy. If someone wanted to I’m sure they could use more modern methods to produce a de novo assembly of the chimp sequence. Long nanopore reads corrected by short reads from standard shotgun methods is all the new rage, and they have already sequenced the human X chromsome telomere-to-telomere using this technology. In addition, BACS are available if someone wants to do localized sequencing and assembly.
To clarify: why are you looking at mitochondrial DNA? It’s mostly coding, highly constrained by selection, and shouldn’t look random.
What’s mysterious about it? We’re talking about long stretches of nearly identical genome. They’re really easy to compare. Do it yourself: chop up some of a chromosome, download BLAST and blast one genome against the other. Most chunks will map to exactly one place and the differences will be mostly trivial to determine. There are always tricky bits, like deciding whether there’s a substitution near an indel, but the basic picture is quite straighforward.
A human-free assembly has also been done, as I recall. The human assembly was only used for large scale alignment, in any case, and has virtually no effect on the the single-base substitution rate.
Small ones, certainly, and recent large duplications don’t have 1-to-1 homologs. I don’t know of large deletions/insertions, but there could be some.
Since you don’t seem to have any idea what was actually done or what’s known, what’s with the tendentiously phrased question? Go read the chimp genome paper and this paper: MUMmer4: A fast and versatile genome alignment system
Again, what is your thinking based on? How much time have you spent annotating genomes?
It is a dataset I can work with, and your result should obtain on any DNA sequence since the distribution is based on biochemistry at the nucleotide level.
If it doesn’t look random, then it isn’t random.
If you mean to say it is undirected, that is a different matter, and I fail to understand how your biochemistry distribution shows mutations are undirected.
But all that is besides the point. The weird thing about my result is not that it looks non-random, but that distant bases are correlated, irrespective of location on the DNA sequence. How can that happen with undirected mutation???
We can see this sort of correlation with human created computer code, but that is because there is an understanding of the semantics of the code that allows for long range correlated changes to occur. Evolution has absolutely no understanding of DNA code semantics, and it is exceedingly improbable to make many distant, correlated changes through random mutation. Natural selection doesn’t help, because these changes all have to happen at the same time.
Do you have a link to this paper? I’ve tried searching Google scholar, and the popular articles, like the Discover magazine article I linked to, don’t reference any papers. All I’ve found on Google scholar is a 2001 paper that only looked at a million base pairs, since the chimp genome wasn’t sequenced yet, and a 2005 paper that says the difference is not 1% but is actually 4%:
The reason for my tendentiously phrased comment is when I look into the actual matter it seems anything but clearcut, and I fail to understand how professional scientists can utter super confident pronouncements on what appears to be fairly ambiguous results, or even worse, results where the conclusion is baked into the methodology.
However, I do like your idea of cutting up a chromosome and blasting sections to find the differences. That is within my bailywick to test, and I like science that I can test for myself ![]()
“Let your conversation be always full of grace, seasoned with salt, so that you may know how to answer everyone.” -Colossians 4:6
This is a place for gracious dialogue about science and faith. Please read our FAQ/Guidelines before posting.