The tobacco industry was quite skilled at telling us that smoking might not be so harmful and got away with delaying legislation to address it.
Sorry for the slow reply, but I hope we can continue this discussion.
When you say ‘If the amount of heat coming in hasn’t increased then solar activity can’t explain the increase in temperature’ does that that mean you say that starting a large cool pot of water on the stove at high temp and gradually reducing the heat input will not keep warming the pot? I sense that you’re lack of response to this analogy suggests that you know that this would not be the case. Indeed, it is evident to all who have observed a pot on the stove, that the pot does continue to warm even when the heat does not increase.
Regarding the car engine analogy, there are a couple of important added observations:
Firstly, if the heat of the internal combustion engine is meant to represent the heat from the sun and the blankets are meant to represent the increase in atmospheric CO2, then I’d say that your relative scale is out of whack, even if your main point is somewhat true - the sun is the dominant source of heat for the planet; increased CO2 in the atmosphere would be more like laying a single layer, smallish blanket on top of the hood; overall, while the engine/sun is the main source of heat, the increased insulation does add to the degree and rate of warming.
Secondly, you seem to be overlooking the fact that there was considerable warming in the first 20 minutes for both engines and that warming will continue to happen in the next 20 minutes, even in the car that changes nothing. In fact, if you measure the temp increase in both engines 20 minutes later, I suggest that you’ll find that the insulated engine warms only modestly faster than the other engine.
To me, this represents a significant scientific process blind-spot for some. Too often I read articles and comments that make assumptions about how dominant the CO2 agw effect is, and that the sun has had nothing to do with the unusual warming at the end of the 20th century, without any serious data observation and discussion. What I see, is that the sun contribute slightly more total heat energy in the latter part of the 20th century than it did in the early part of the century, which would suggest to me that it would contribute at least as much warming.
Ultimately, I have no illusions about what impact my words might have with you, or any other readers, but I do hope that there will be proper consideration of the continuing accumulation of the real-life climate data, especially over the new several years, in case we will learn something rather important. Seeking the whole truth in these matters is just as important as guarding against possible disaster.
Hi Bill,
I appreciate that you are trying to consider both sides of the debate carefully, and that you’re trying to reason as carefully as possible in this amicable conversation.
In the spirit of the conversation, I would like to submit some important points for your consideration:
The early climate models have already proven quite accurate
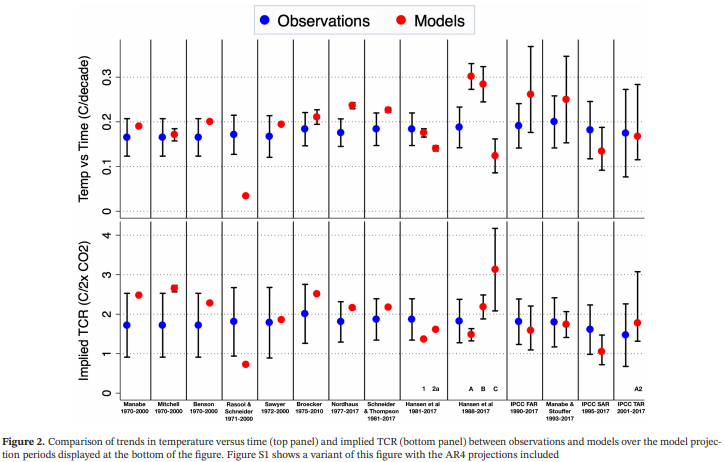
In 2019, scientists at Cal, MIT, and NASA published a retrospective on the accuracy of computer model predictions. The result is a strong affirmation of the utility and accuracy of the models:
climate models published over the past five decades were generally quite accurate in predicting global warming in the years after publication, particularly when accounting for differences between modeled and actual changes in atmospheric CO2 and other climate drivers. This research should help resolve public confusion around the performance of past climate modeling efforts and increases our confidence that models are accurately projecting global warming. [emphasis added]
A picture is worth 1000 words:
Existing climate models already incorporate fluctuations in solar activity
Please correct me if I’m wrong, but you seem to be claiming that
- Existing climate models are based on greenhouse gases and cloud cover but do not take into account fluctuations in solar activity, and
- Once solar activity fluctuations are accounted for, the predictions would change.
However, this understanding of the models is not accurate. The models do in fact already account for historical and predicted fluctuations in solar activity:
Climate models are run over the historical period, from around 1850 to near-present. They use the best estimate of factors affecting the climate, including CO2, CH4, and N2O concentrations, changes in solar output, aerosols from volcanic eruptions, aerosols from human activity, and land-use changes.
In particular, climate scientists have been working very hard to improve the quality of the solar activity data in order to make sure the latest IPCC models are as accurate as possible. Here is the conclusion of the 2017 report on solar activity data that improved the input of solar activity data into the 2018 IPCC model:
“In our future scenario for CMIP6, we provide a more sophisticated estimate of the future development of solar activity after 2015,” explains Dr. Bernd Funke, co-author of the study. “By 2070, a decrease of the sun’s mean activity to a smaller solar minimum is expected. This counteracts the anthropogenic global warming signal, but will not have a significant influence on the development of global average surface temperatures,” Dr. Funke continues. However, regional effects should not be negligible. In addition, for the first time, a quantification of solar irradiance and particle effects will be possible.
Scientific disputes are resolved by better models, not by hand-waving generalizations
Anyone who disagrees with the IPCC models, in spite of their historical accuracy (point 1) and inclusion of all relevant factors such as solar activity (point 2), is welcome to build and test a competing model using the same standards of math and computation that climate scientists already use.
However, vague references to notions like solar activity that are not accompanied by a competing mathematical/computational model that makes better predictions are of no value in a discussion.
Show your math, your numerical predictions, and your numerical evaluation methods, though, and we can have an honest and productive discussion of alternative climate models.
Best,
Chris Falter
1 Like
Does it get cooler in the winter as solar input decreases? Or does it get hotter in the winter, as your model seems to predict?
Really? My car hits a steady temperature after just 5 minutes or so.
Make assumptions? Is that what you think climate scientists do? Has it ever occurred to you that they may have real models that calculate the effect of CO2? The first such calculations were done by Svante Arrhenius clear back in 1896.
It goes without saying that his model was oversimplified and has been refined over the years, but your claim that scientists are simply assuming the amount of warming CO2 will cause is laughable. I think we are dealing with a Dunnin-Kreuger effect.
2 Likes
When there are disagreements, building better models only conflates the issue. Each modeler will build their model to ‘fit’ better the historical numbers with their own assumptions built-in using whatever fudge-factors they need. The only truth arbiter of these debates is the real-life data. While the data can still be looked at in a variety of ways, it is the data and we don’t have to wonder what assumptions are behind it.
For me, the big question is whether the CO2 climate sensitivity currently used in extreme warming projections will stand up to the next several years of real-life data.
After 7 consecutive above-average solar cycles (roughly 1935-2005) and the corresponding unusual warming, we then had the first below-average solar cycle in more than 80 years (peak circ 2014) associated with the warming hiatus, and then, more recently, a period of uncertainty with temp spikes in 2015-16 and 2019-20 mixed with temp drops in 2017-18 and again in 2021, at the same time that the next solar cycle is starting into a likely second consecutive below-average energy input. If this projected low-energy solar cycle does happen (peak circ 2025), then we would have the first back-to-back below-average solar cycles in more than 180 years. I would say that the true scientist would be anxious see what the actual global temp response is in, and around, that time-frame and try to understand what it means to our understanding of the bigger climate puzzle. Certainly, if global temp increase slows, seemingly driven by reduced solar input, then we’ll want to re-assess the ‘official’ claims about the magnitude of the CO2 warming drive.
Well, Arrhenius did do some important work to identify and describe the re-radiation effect of trace amount of CO2 versus the predominant amounts of O2 and N2 in the atmosphere. However, quantifying the almost insignificant change in relative atmospheric content of the gasses (yes, CO2 itself has increased significantly compared to its previous levels, but it is still a trace component in the total atmosphere), is not so easy.
Modelers have attempted to match historical records with mathematical formulas so the they can come up with some sort of future projection. This is based on ‘assessment’ of the main historical climate factors (as best we can do with the rough data that we have).
Unfortunately, this assessment is open to bias. In the case of the critical other warming factor, the sun, in order for modelers to assess that the same amount of solar energy input caused significant warming in the early part of the century and then had no effect on warming in the latter part of the century, needs some short-cut, or bias, or assumption to be made. On the face-value, it just doesn’t make sense.
In case you didn’t know, the total solar energy input for 42 years at the end of the 20th century (1965-2006) was actually higher (as represented by sunspot count - 50,448) than the similar 42 years in the early part of the 20th century (1913-1954…42,371 accumulated sunspot count).
It is only based on the assertion by CO2 agw proponents that the sun had no impact on warming at the end of the 20th century, and therefore increasing CO2 was the dominant cause of that unusual warming, that the models are able to claim a serious agw problem.
What would be really useful for all of us, is to have an extended period of CO2 increase with continued below-average solar energy and see which one really has more drive. The good news for proper climate science is that we may have such a study in the making. The up-coming solar energy peak (circ 2025) is predicted to be below-average, which combined with the prior below-average cycle, will give us the first back-to-back below-average solar cycles in more than 180 years. That should give us some very important data. It would be even better, if we could somehow arrange to have the next solar cycle stay low to help us really establish a longer-term pattern. Unfortunately, we barely know enough to predict one cycle ahead (sometime around 2025-26 we’ll have a reasonable guess at what the next solar cycle will do) and, of course, we have no ability to actually control what the sun does. Its left for us to be open and objective observers of what goes on around us.
If we stop burning plastic and learn to recycle more plastics then that would be one way in which the carbon from fossil fuels would not be going into the atmosphere. Otherwise some are concerned that disposing of plastics by burning them is threatening to become one of the biggest contributors to global warming.
The scientific consensus among scientists with degrees in climate science or closely related fields (97% in fact) is that the climate is warming and humans are responsible for it.
1 Like
Actually, no amount of consensus replaces real-life data. And that’s the problem - we’ve side-tracked our science into a ‘what do you think is most likely’ narrative, away from solid data and evidence.
Again, yes there has been warming - the evidence backs that. There is also good evidence that an increase in atmospheric CO2 would be responsible for some of the warming. The difficulty is with how much effect there is from CO2.
If we took the amount of warming from the early 20th century (approx 0.10 C/decade), which is fully attributed to solar energy input, assigned that same amount of warming to the slightly higher total solar energy input in the latter part of the century and reconciled the warming amount, along with growing natural positive feedbacks, then the observed warming of approx 0.15 C/decade has something approaching 0.03 C/decade unaccounted for and presumably attributable to CO2. The comparison of solar impact versus CO2 impact is interesting - solar roughly 3 times as important as increases of CO2 over the 42 year period 1965-2006. The amount of warming impact from CO2 becomes less than half of the CO2 climate sensitivity currently incorporated in most IPCC approved climate models. I think you can see that this is a big discrepancy and needs to be answered.
Newsflash: scientists study real-life data and evidence. Really.
2 Likes
You seem to be accusing climate scientists of outright misconduct. Do you want to stand by the impression you gave, or do you want to clarify?
Which is exactly what the models use. They perform hindcasting over many, many decades, then they forecast decades into the future.
As I previously noted, these forecasts have already been assessed for accuracy. Since you do not address the accuracy of the previous climate science models, you give the impression of not reading my post carefully. I am going to take the liberty of repeating so we can have an honest and productive discussion.
We already have over 4 decades of meteorological data that can be used to evaluate the work of climate scientists.
It is of course theoretically possible that all of a sudden the models will stop being accurate, just as it is possible that when my alarm goes off tomorrow morning I will be floating on the ceiling. But I would not count on either eventuality.
Actually, I did process it. Succinctly: You gave an analogy, but in a scientific discussion analogies have no value. If you want to make scientific claims about climate trends, you need to present a mathematical model that renders more accurate hindcasting than competing models.
Your analogy has not been evaluated on even a fractional percent of the data that has been used to evaluate IPCC models. I have no way of evaluating your analogy other than to say that maybe you have a good point and maybe you do not. If you want the world to pay attention to your idea, you will have to show that it deals more accurately with the petabytes of climate data than competing models.
I believe you could take the IPCC software code, tweak it the way you think it needs to be tweaked, and run some computations on a compute cluster. Please tell us how you change the code, and what you find out after running your model.
Best regards,
Chris
EDIT: Much of the IPCC analysis pipeline probably uses MPP rather than Spark. Hence I changed “Spark cluster” to “compute cluster.”
3 Likes
You have asserted this without presenting any empirical evidence. Meanwhile, the computational models, which have proven to be highly accurate both in hindcasting and forecasting, disagree quite strongly with your undocumented assertion.
Best,
Chris
4 Likes
The evidence abounds. I’m sure you’ve seen the one that shows TSI ups and downs. Well, the sunspot count is a direct parallel showing the same cycle timing and relative magnitude of the solar energy input. The advantages that I see for the sunspot chart are that the data goes back further - so we can get a better perspective on long-term pattern - and, I can easily see the data for each month to aid the summing of the area under the curve. Here is the site -
https://www.swpc.noaa.gov/products/solar-cycle-progression
You’ll notice that this NOAA data and not some random made-up thing. When you open the page, you’ll see the highlighted range in full, with the longer-term on a sliding scale below. You can move along the time-scale to look closer at any part of the history. There is other info further below, but I’ve concentrated on the sunspot count.
When you assess the data set as a whole, you can see that there are roughly 10 (soon to be 11 with the predicted below-average cycle 25 arriving sometime around 2025) solar cycle peaks on record as topping out at less than 150 sunspots, with the lowest (circ 1804) at 75-100 and most around 125-160ish. There are another 15 that peaks at, or above, 170 sunspots, with the highest one, identified as Cycle 19 (circ 1958), reaching roughly 300 sunspot count, and the lowest of these above-average solar cycle peaks (no. 20, circ 1969) showing a range of monthly sunspots through the top of the cycle roughly in the range of 150-180. (Note: this totals 26 cycles, including the one that we are just starting into, but this latest is officially numbered cycle 25. That’s because they only have data for about half of what I think of a cycle 0, but it includes what would be the peak of the cycle. So, I’ve included that cycle as one of the below-average cycles) Another thing to notice is that not all solar cycles are the same shape - some are more extended at the peak than others and surely would have more warming impact, even if the absolute peak is not quite as high, and some have more extended low period, which surely would tend to give less warming than a cycle that had only a short-lived low. As a result, I’m thinking that some method of total energy input calculation is needed rather than a simple tracking of ups and downs.
My first thought with this data, is to try to understand how much tracking there is for total solar energy - in this case represented by sunspot count - versus the global temp record. In the media lately, we seem to have focused on only the most recent warming, but, of course, climate has been happening for much longer.
It is interesting that when there are stronger solar cycles back-to-back, there is more of a pattern of warming. For example - 1913-1945 had 3 successive above average solar cycles and there was a significant warming of the earth’s surface temp; 1965-2005 had 4 above-average solar cycles in a row.
(Note: I don’t have an easy chart for you to see both historical temp and sunspots together, but there are lots of temp charts you can compared with - here’s one if you don’t already have one that you use …
and similarly, when the solar energy dips particularly low and for an extended period of time, there is more of an effect on global temp, initially to slow, or stop, warming and then, possibly lead to a little cooling, if the heat is low enough for long enough. For example - 1875-1915 had 3 below-average solar cycles in a row and there was almost no added warming. The warming pause in the 50’s and 60’s I think had more to do with shielding from particulate matter from volcanoes and car exhaust.
Now, before we get too deep into this analysis, let’s acknowledge that there was already some greenhouse gas effect, even 200 years ago, and that there was some increase of CO2 prior to 1950. So, not all of the warming dating back to the 1800s and early 1900s should be attributed to the sun and since about 1950, the green-house gas impact will have increased. The big question is - how much of an impact is there from increasing CO2 levels ?
For a high-level view I found the following to consult -
There you can see the relative change of CO2 content, along with some measure of associated greenhouse gasses and their estimated contribution to radiative forcing. There appears to be little change of ghg levels prior to 1880, as far as we know. Then, between 1880 and 1950, CO2 increased from about 290 ppm to 310 ppm and has increased more and faster since then.
Still, I find it a challenge to apportion the respective amount of impact for different factors. It appears that a certain amount of above-average solar heat was responsible for most of the warming prior to 1950, although not all. When that same amount (actually even more) total solar energy is applied later, it seems to me that it would have the same, or slightly more, impact on warming. So, I disagree with assessing the effect from the sun since 1950 as negligible (IPCC - AR5), with the excuse being given that, because it wasn’t increasing, it couldn’t be responsible for any of the warming. If we turn around and account for the same amount of warming from the sun, then you get a much lower impact from anthropogenic CO2. In addition, there is the possibility that solar activity can affect cloud cover extent in such a way that it would be a natural amplifier of changes in solar energy input, further reducing the amount of effect that could be attributed to the changes in ghg concentrations (not included in IPCC considerations). Plus, there is the natural positive feedback from less ice and snow cover (also not included in IPCC considerations), that would further reduce the assessed impact of ghg over the past 70 years.
As you can imagine, I’m thinking that the effect of increasing CO2 on global warming is something less than half of what IPCC has proclaimed. I don’t even attempt to understand their motivations for pushing exclusively in the CO2 direction, as it seems to me that a proper scientific approach would be to continue assessing all possibilities. Nevertheless, let me at least say that increasing atmospheric CO2, largely from anthropogenic sources, is responsible for a noteworthy portion of recent warming and will only increase if not addressed.
For me, the present level of action around working to incorporate alternative energy sources in a measured, cost-effective manner, as well as continuing to limit, and begin to reduce, total CO2 emissions, is important and worthwhile, in order to help insure against a potential future crisis. However, it doesn’t come even close to presenting a current, nor even foreseeable, climate emergency. We need to keep watching the ever-accumulating data with a properly open and objective attitude so that we don’t trap ourselves into any particular, potentially wrong, understanding of reality.
1 Like
Hi Bill,
It’s clear you care about this subject, and you are trying to do your best to research it. This is not, unfortunately, a topic that can be understood by eyeballing charts of solar activity, CO2 levels, and temperatures. Climate is a highly complex geophysics system whose analysis requires the coordination of hundreds of geophysicists and supercomputer clusters.
What you’re doing is kind of like trying to argue with the team of physicists at CERN about whether the Higgs boson exists.
Yes, there are petabytes of data to consider. This is why climate scientists have been building computational models and running them on supercomputer clusters for 50 years.
The conclusion emerged from a lengthy and peer-reviewed computation of the petabytes of data.
What you read was a summary of that computation. The conclusion was computed from a huge body of evidence, not assumed.
They ARE assessing all the possibilities. Have you even read the IPCC descriptions of their data inputs and computational models?
Here’s a link to the 5th IPCC report. Since the subject interests you so much, I think you’ll enjoy it from cover to cover. Bear in mind as you read it that it is the tip of the tip of a huge iceberg of scientific work. From the references you can follow links to IPCC technical reports (the rest of the tip of the iceberg), and from the technical reports you can follow links to the peer-reviewed literature (the rest of the iceberg).
A similar process is playing out in the 6th IPCC, whose final report is due next year. Some of the technical reports have already been issued:
- Special Report: Global Warming of 1.5o C.
- Special Report: Climate Change and Land
- Special Report: The Ocean and Cryosphere in a Changing Climate
- Methodology Report
The final technical reports will emerge this summer. Together with the above reports, they will form the foundation of next year’s final report.
Meanwhile, a vast, peer-reviewed climate research literature has accumulated over the past 7 years. A good starting place would be Ari Jokimaki’s curated list of links on over 150 topics in climate science.
Follow the links from the most interesting topics to the research papers. Be sure not to skip over the methodology sections, which are the heart of the scientific process.
God bless you on your journey.
Chris Falter
1 Like
It is relatively easy to model the contribution of CO2 because Arrhenius did just that in 1896. What is more difficult is modeling the movement of heat in the atmosphere and in the environment.
Then show us the bias in the calculations. Until you do so, you are just making stuff up.
It isn’t an assertion. It is science backed by empirical evidence. The only thing you have presented is assertions that lack any evidence and only seemed fueled by a lack of understanding and conspiratorial thinking. Your claims would lead us to believe that winter should be warmer than summer, for crying out loud.
1 Like
‘It isn’t an assertion.’
You may not want to think so, but until someone shows how one amount of heat energy input in one period drives substantial warming and then later an even larger amount of heat input is deemed to have no impact on warming, the whole CO2 warming crisis is on shaky ground. There is no science, no empirical evidence, that says a heat source must continually increase in order to add warming.
Fortunately, all of our back-and-forth banter will be clarified with real-life data soon enough. With the sun energy expected to be below-average for a second consecutive solar cycle, making for the lowest 20+ years solar energy period in more than 180 years, we’ll finally have a significant test of how strong the sun’s impact is versus the gradually growing impact of CO2 ghg effect.
Of course, there will be continuing complicating factors such as positive natural feedbacks from heat built-up in the oceans and added heat generation from less ice and snow cover, but we have pretty good estimates of how big these factors are. So, beyond the natural feedbacks, will there be an increased rate of warming due to strong influence from increased CO2 level and little to no impact from changing solar energy, or will a stronger influence from solar energy in neutral and only a modest effect from increasing CO2 ghg, give us a reduced amount of warming? Then we’ll be able to fine-tune the climate models even more to reduce the amount of predicted future warming we could have. A frustrating challenge will remain, in that we don’t have any way to predict long-term solar activity, but at least we’ll have a clearer sense of a lesser impact impact of CO2.
It already has been. The real-life data is already there, which I believe has been the point of many who’ve been responding to you.
You don’t get to selectively always claim that the jury is still out until just the right moment where you might get some favorable result. That’s sorta like saying “the election hasn’t ended until I win it.” Science / reality just doesn’t work that way.
[That’s not to say that new data can’t change things. But it never makes the mountains of old data disappear. All of the data needs to be dealt with. And that’s what science does - not just the selective data you want attended to in order to manufacture unwarranted doubt.]
3 Likes
I already did that.
What you are forgetting is heat OUTPUT, which is the amount of heat that escapes the Earth. Both input and output are important. If the Earth radiates less heat out into space then the Earth will warm.
In the early and mid part of the 20th century the output was nearly the same because there hadn’t been a large change in greenhouse gas to that point. In this time period the input was the main driver. Later in the 20th century there was a rapid and drastic change in heat output which drove warming.
Think of it like a bank account where you have wages going in and money for bills going out. If you get a raise and your bills stay the same then your bank account will rise. You can also have a situation where your wages decrease but you cut your bills even more and that will also result in your bank account increasing.
It already has been clarified:
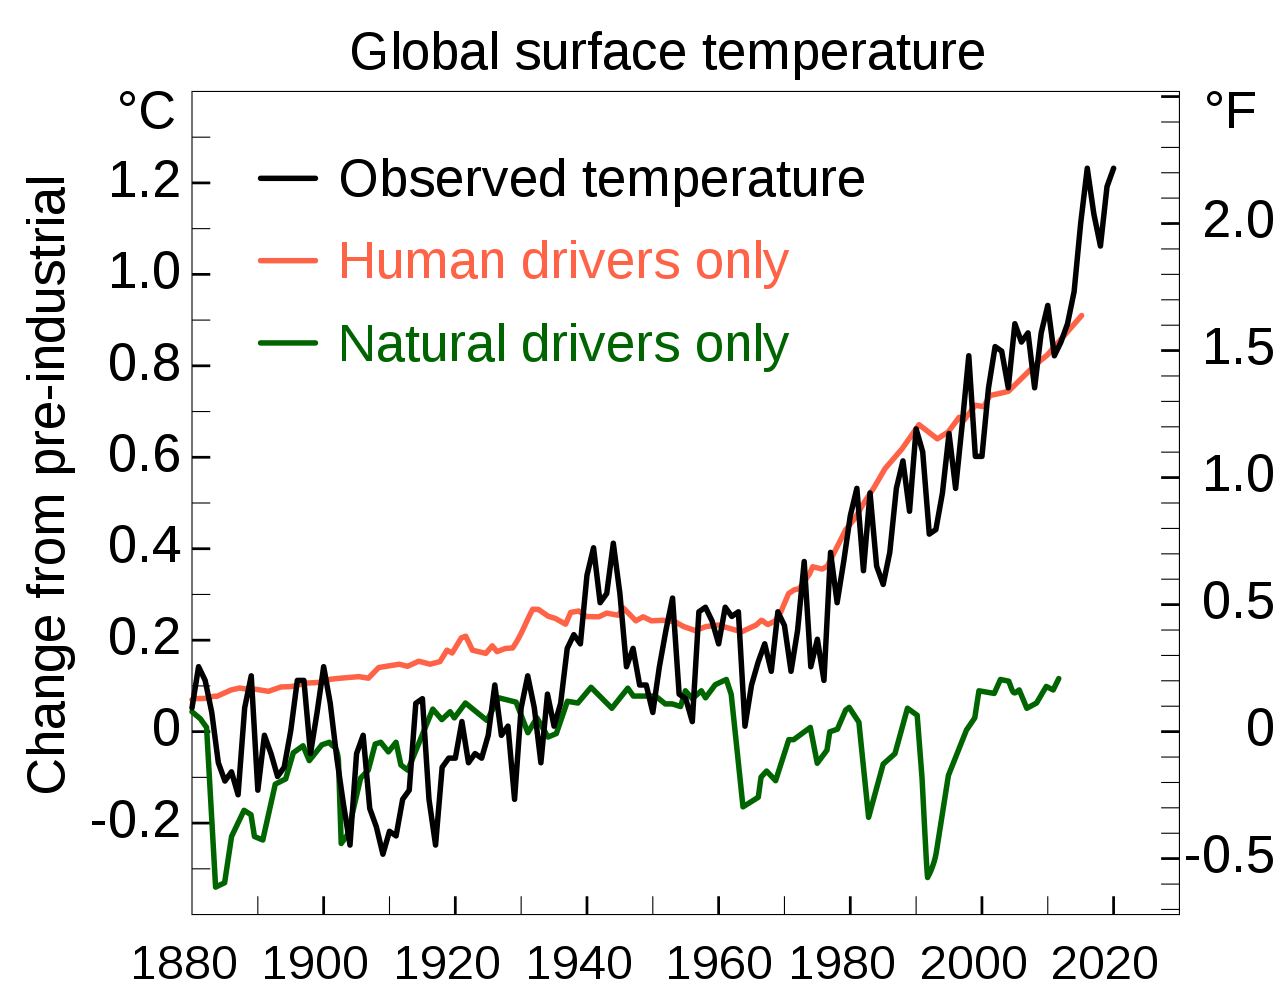
" Observed temperature from NASA[1] vs the 1850–1900 average used by the IPCC as a pre-industrial baseline.[2] The primary driver for increased global temperatures in the industrial era is human activity, with natural forces adding variability.[3]"
The green line is where temperatures would be without carbon dioxide.
3 Likes
Hi Bill,
The forum software displays the number of times links have been clicked. So far, the number of clicks on the links I have posted is a big fat zero.
So I am wondering how it is that people need to step up and show you information when, having a treasure trove of info already at your disposal, you seem to show no interest in exploring it.
Best,
Chris Falter
2 Likes
The green line is where temps would be based on the precept that solar energy must continue to increase in order to drive warming, for which I see no serious evidence, only conjecture by those who need an argument to allow for more impact from CO2. On the other hand, you and I can do a very simple experiment on our kitchen stoves to prove that heat does not have to continually increase in order to add warming to a system.
I do understand that there is a lot of climate material that has been produced based on the assumption of little, or no, solar-driven warming 1965-2006, but no real evidence to back that assumption. To the contrary, when you add up the total heat input from the earlier solar-driven, strong warming period (circ 1913-1954), you find that it was less and yet still considered the primary warming driver at that time. How can even more heat, over the same 42 year time-span, later the same century, not be responsible for at least as much warming?!
The is no direct answer, because it is not true. Unfortunately, it has become such a cornerstone of the IPCC-directed modeling that it will take quite a bit to convince IPCC and its collective following to see the error. However, with the sun now roughly in neutral (soon to have two back-to-back below-average solar cycles for the first time in more than 180 years), we’ll soon see just how much warming we get from CO2 by itself.