The graph is a little tricky to read, so let me aim to unpack it a bit. To begin, the vertical bars mean nothing- it is only the horizontal bars that are important. The greater their length, the greater number of substitutions per site. So let’s take go through a few parts of it. Let’s look at the homo sapien section first:
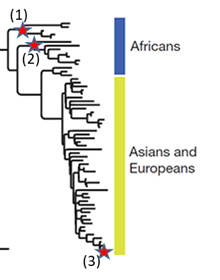
I’ve went ahead and marked three spots with stars, two at the top and one at the bottom. How different should one read first (1) and (2) to be? Well, you have to go back to their common ancestor to compare them as they were once related based upon where they connect. Or this point marked by the yellow star:
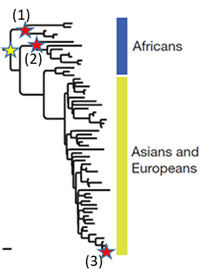
You need to measure how far away (1) is from the yellow star horizontally and then take that distance relative to the scale bar. It’s approximately equivalent to 0.0007 substitutions per site. Very similar! But how does (1) then compare to (2)? Well we need to figure out how far away (2) is from their common ancestor. You can do the same thing, adding up the horizontal distance from (2) to the yellow star which gives us 0.0013 substitutions per site. Nearly twice as much as the distance from (1) to the star. So how then should we think of the genetic difference between (1) and (2)? Well, we know that (1) is different from a common ancestor by 0.0007 per site and (2) is different from the same common ancestor by 0.0013 per site. The simplest way would just be to add them. This would not be perfect as they could get the same differences but due to the randomness and improbability of such, we can consider them mutually exclusive and add them. So (1) is different from (2) by 0.002 substitutions per site! So then how about we ask how different is the most genetically diverse group of humans (3) from say the tip of the branch that (1) is located on? Well (3) is 0.0045 substitutions per site away from the common ancestor of all homo sapiens (the yellow star) and then you can add any other branch lengths. The furthest point along the branch with (1) is 0.003 substitutions per site away from the yellow star. Thus all the genetic diversity of humans corresponds to about 0.0075 substitutions per site maximum (though in many cases can be less).
Now how about humans and Denosvians? Let’s look at the graph one more time:
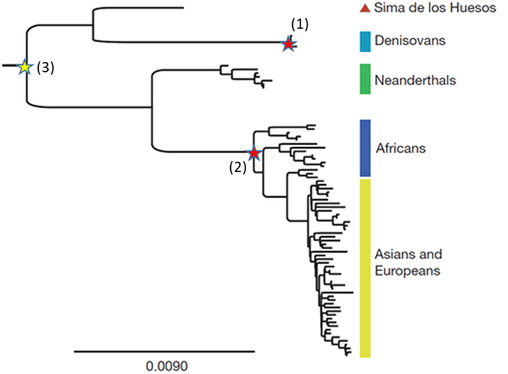
How different is the Denosvian genome compared to the human genome? Let’s just compare points (1) and (2) on the graph. You first have to add all of the horizontal distance to their common ancestor (3). So we find that the distance between (1) and (3) is about 0.0135 substitutions per site and the distance between (2) and (3) is about 0.012 substitutions per site giving a total difference of humans and denosvians of about 0.025 substitutions per site.
Thus in total we can say that Denosvians and ancient humans have over three times the substitutions per site (and even higher comparing them to modern humans) than all humans do alive today.