Ages of Patriarchs

I appreciate your thoughts. Long live geekiness. I Googled “gematria, patriarchs, ages” and got some interesting results on patterns and numerology, but haven’t been able to read them.

Why not a combination of reasons? Honorific for the oral history phase and translation difficulties for the early written history?

1 Like

The case of cursing Canaan, grandson of Noah, for Ham’s sin; and the general idea of curses down generations, seems to play that role, as per Enns

Translation difficulties that just happen to result in an exponential curve?

That portion of the curve is almost a straight line. And the number of samples is really getting small.

Exactly. Without Noah, it’s a straight-line slope. Even with Noah, there’s no precipitous drop if the x axis plots time (my first chart last post) instead of generations, since Noah was 500 when he had his sons.

It’s worth noting that Noah’s numbers aren’t given in the Genesis 11 genealogy that shows the post-flood decline. His total age is much higher than his father and higher than everyone in the first half of Adam’s genealogy in Genesis 5. He had the third-highest lifespan in the Bible, so of course a chart that starts with him will show a big drop.

Further, if this decay curve is supposed to arise due to environmental conditions changed by the flood, keep in mind that Noah lived 600 years before the flood (even Shem lived 100 years before the flood). I don’t know how one wants to suppose a flood affects 600- and 100-year-old people’s lifespans, but if we assume those pre-flood centuries gave them some kind of a bump in total years lived, any hint of a sharp decline at the beginning of the chart evaporates.

But maybe I’m wrong. Maybe I’m just trying to explain away the obvious. If so, I have exciting news: the New Testament also has a decay curve hidden within it. This one is even clearer. It’s found in the length of Paul’s writings to the church. This begins with Acts, of course, which includes material about Paul by his associate, Luke. Then is Romans, 1 Corinthians, etc. to Philemon. Here it is in all its glory, easily found by counting the verses in each book and plotting them in their canonical order:

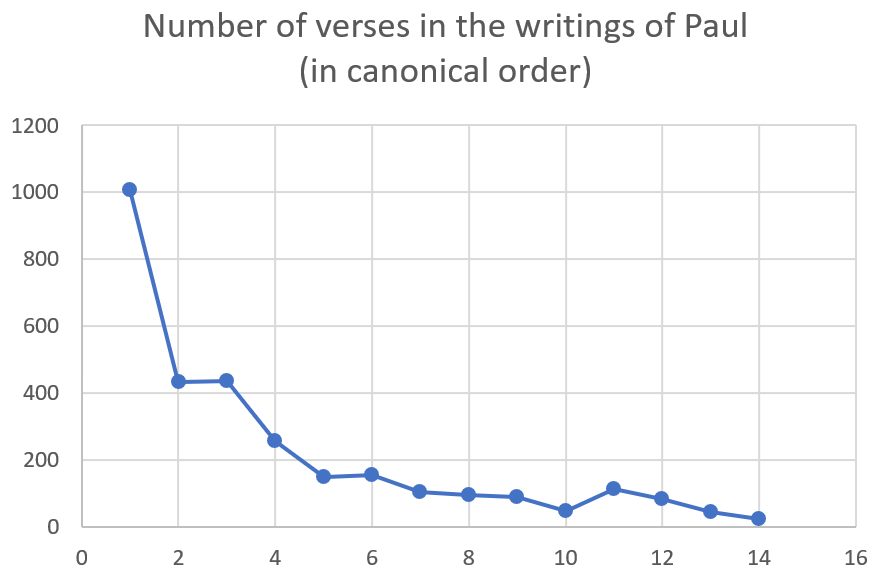
Some naysayers may object to my inclusion of Acts, but Acts fits as clearly as Noah fits into a plot of post-flood lifespans. They may suggest that if I include Acts I should include Luke too, but this ignores the distinction Pentecost makes. Adding one of the gospels means we’re not plotting the same thing anymore. That would be like adding Lamech before Noah, ignoring the distinction the flood makes.

No, obviously the decay curve is real. It beggars belief to think Paul contrived this pattern through carefully shortening the length of his letters. Those who ordered our New Testament wouldn’t have had the mathematical acumen to create it. A pattern like this could not have been imposed from below, so it must come from above. :upside_down_face:

3 Likes

Numerology is interesting in other religions too–most of it is easily explainable by stats. Islam has a long history, and they use it to imply divine giving of the Qur’an. Answeringislam.org refutes a lot of that.

It’s interesting stuff, of course. A family friend of ours was deeply into Biblical numerology at one time; but it seems most of that is statistical variation.

Interesting enough, and given such an improbable ordering, I would not be surprised to learn that something beyond random chance is going on there. Is there reason to believe that the epistles were ordered generally from largest to smallest? I’ve never actually given thought to what order the episodes are in.

But yes, even if tongue in cheek, I’d object to including acts in the list of “Paul’s writings” just so you can make your chart appear like the curve were speaking of. Even if half joking, I always object to people manipulating data to arrive at a desired conclusion.

:stuck_out_tongue:

1 Like

And by the way, I appreciated what you said about cherry picking data earlier, but I’m afraid this strikes me as a reverse form of the same thing. There is a patently obvious reason why, for my question, it is natural and necessary to start with Noah’s age: because his age was generally consistent with the rest of the patriarchs before him, and from him is where any perceived decrease in average lifespan begins. Thus that is the data from which we are measuring any proposed or suggested reduction.

This is like me measuring geographic formations, and observing that a certain elevation on top of a plateau is remarkably consistent, and then there is a precipitous drop until it eventually curves and levels off, And you object, saying, “it only appears precipitous because you arbitrarily measured the decrease in elevation from the top of the plateau. If you started your measurements halfway down the incline you wouldn’t have detected any so-called precipitous drop!”

Fair enough. What was I thinking?

Yeah, Acts doesn’t even shift to focusing on Saul/Paul until chapter 8, a quarter of the way through. Placing the whole book into a grouping of Paul’s church teaching is almost as ridiculous as charting how lifespans changed with the flood beginning with someone who lived two-thirds of his life before the flood!

But you gotta admit, with a bit of special pleading for the first point, it’s easy to turn a linear descent into a sweet curve. (In fact, the curve in mine holds up better without Acts than the other one does without Noah. But the first point, in both cases, really makes it sing.)

Fair point, but then you’d want to start with someone who lived their whole life before the flood. But adding Lamech also destroys the curve, since Lamech only lived to 777 (and his life wasn’t cut short by the flood).

I’m not sure anyone is suggesting the ancient Hebrews saw death as non-existence. It was about going to sheol, the grave, a gloomy and sleepy place where earthly distinctions fade and nothing significant happens.

Enoch didn’t die and go to sheol, but was somehow taken by God. To me, it doesn’t look like God vaporised him. I see how one could read “then he was no more” as meaning that, but when that phrase is explained by “because God took him,” it suggests he was no more on earth but instead was in God’s presence. It’s not about his body being destroyed, but moved.

Yes, the Bible authors did not have the math. No, the math does not validate the data. You can always perform regression analysis to fit a exponential function to data showing a general trend. Only the constants will be different. If the standard deviation is too high for your liking, simply eliminate the offending points. The genesis narrative shows declining lifespans. That is all. If you wish to challenge this, please review a text on non-linear regression first.

Mark Twain said it well; “There are three kinds of lies: lies, damned lies, and statistics.”

3 Likes

I object since Paul didn’t write Acts. It is also a different type of literature. Acts is a historical narrative whereas the rest are letters. Adding Acts means we’re not plotting the same thing anymore. Without Acts you still get a curve but nowhere near as pronounced.

There is a very good reason for including Noah’s age as the starting point since lifespans up to that point showed very little decline. Noah’s age therefore serves as a proxy for the pre flood condition.

Sure, and many would object to me including the pastorals too, or say Philemon is quite a different genre from his church letters. But if someone was going to collect the New Testament material relating to Paul, then Acts (containing some of his speeches and lots of historical detail) and all the letters claiming to be from his hand would naturally fit together.

Remember, I’m not really saying this pattern exists. I do think it’s contrived. That’s the point.

Not really, since Noah also lived after the flood and presumably would already be somewhat affected by the changed atmosphere afterward. As @Daniel_Fisher mentioned above, if we really want to see the effects of the flood on lifespan, we need to start with someone who lived before the flood. That would mean starting with Lamech, whose 777-year lifespan turns the downward slope into a hump.

The shape of the curve is extremely fragile because it is artificial.

2 Likes

I for one am making no connection here between the flood and the decline in ages… that’s your assumption that was brought into this discussion. I am only exploring the sudden decline in ages and trying to explore any and every proposed explanation for such.

As such, Noah will do just fine, being as he is the clear end of the former general pattern before the clear and obvious decline begins.

The point of that curve came from the Genetic Entropy book written by Sanford. He uses that curve as Biblical evidence that the human genome is deteriorating (and all genomes deteriorate, thus evolution can’t be true). So that’s where the flood stuff comes in. I understand that you aren’t arguing that point, but it is where the idea of the curve comes from, as far as I know.

And again, if we extend the data to known ages in the New Testament, we’d have John in his 90’s that completely misses the curve. Instead, they used Roman average lifespan of 45, even though he was NOT plotting average lifespans elsewhere.

1 Like

The exact shape of the curve, sure. And I’m not married to having it need to be some exact correspondence to a decay curve like you’d find with radioactive decay, though I certainly see a resemblance. Perhaps we’re talking past each other by me emphasizing that word…

The obvious facts, though, which are indisputable…

  • for ~9 generations there is clearly ages which are extremely high, averaging around the 900+ range, from low of 777 to high of 969…

  • then you have a precipitous drop, such that by merely the fifth generation after Noah, we never get above 250.

  • At which point, there is a continual, gradual trend toward decline, though far less extreme than those first five generations after Noah until we arrive at (and continue past) Abraham and his descendants.

Can we concur with the above 3 facts, at least?

My only point in calling it something approximating a decay curve is that it is not a simple linear decline, as Chris reminded me. Between the two choices, it closer approximates a decay curve than a linear decline. Can we agree thus far, at least?

After all, If I were, hypothetically, positively arguing here for some kind of postdiluvian environmental effect on lifespan, it wouldn’t impact my argument much one way or the other if the ages declined in a decay curve, or in a linear fashion. I imagine either would superficially support that hypothesis.

What is striking to me is that, if I imagined an ancient redactor, doing his numerology, or trying to combine two disparate traditions of ages, and was trying to connect pre-Noah 900+ ages with the Abrahamic ~175 ages, I would anticipate him inventing a roughly linear decline in ages, the generations between Noah and Abraham showing something like 810, then 770, 707, 632, 575, 510, 385, 330, 260, or something in that ballpark. Instead, he expresses an immediate decline to 600 then down to the first plateau you noted of 3 in the 400s, then immediately to a lower, steady, gradual decline starting at, what, 239? My only observation is that this is clearly not linear, and it resembles a decay curve in the sense that there is a precipitous drop from Noah (who were using as referring as he is the edge of the precipice, as we are not worried about the flood, right?) for the 5 generations after him, (dropping a striking 711 years over just 5 Generations) then we have a slow, gradual decline, dropping merely 64 years over those next 5 generations.

However you slice it, this is a remarkable precipitous decline, followed by an unremarkable but noticeable gradual decline. That sis all I mean in saying it approximates a decay curve. That phenomenon I simply find intriguing, and am trying to make sense of any and every possible explanation for this striking non-linear decline. Can we agree thus far at least?

2 Likes

Psalm 90:10
Our days may come to seventy years, or eighty, if our strength endures; yet the best of them are but trouble and sorrow, for they quickly pass, and we fly away.

Here’s hoping for the eighty!

2 Likes

I was wondering what the data would look like if I plotted the ages against the year of birth. The ages fall into 3 distinct groups. The first 9 generations for a straight line that is actually sloping up. There is a second group of the generations after Noah that form a cluster. And then you have the remaining ages that seem to fall on a straight line with a negative slope. The 500 year difference between Noah’s birth and his first son’s is so striking I thought I had made a mistake in inputting the data. My old version of Excel can’t do a curve fit for a scatter chart, but it isn’t any kind of decay curve. Reminds me of the curves we got tuning rf circuits in the old vacuum tube TVs. I am sure you can do a higher order curve fit but it is kind of pointless. Interesting that the 3 groups sort of match your 3 points above.

Math is fun, despite what people say about it.

2 Likes

In particular it is in contrast to Adam - Noah. Excluding Enoch who didn’t die you get lifespans of 777-962 years with little variation. In fact if you exclude Lamech you get a trend of increasing ages. Just assessing the data visually, which is a pretty good place to start, you could well say there is no significant upward or downward trend. That makes the change after Noah all the more striking.

As Boscopup has pointed out above the ~40 years the Israelites spent in the wilderness would suggest that average lifespans had already declined to about 70 years, so Moses and Aaron lived long lives for that time.

So we have a pre flood period with lifespans generally over 900 years; then a sharp post flood drop that levels out to about 70 years.

The data shows the sort of variation you would expect with real data, not a smooth transition. Either it’s real or the author was particulalry sophisticated in it’s fabrication.

1 Like

I have no real interest in the lifespans of Genesis. But a like, totally unsophisticated dude could pull these ages out of thin air no problem. As discussed above, there is no statistical case to support otherwise.

1 Like