Ages of Patriarchs

Ah right, thank you @Daniel_Fisher, I see what you are getting at now. Thank you for clarifying.

Let me do a bit of revising and adjusting in light of your clarifications.

Firstly, when talking about the ages not being literally it is always hard not to make it sound like I’m saying the human author simply plucked numbers out of the air. That is not what I think at all. I do believe that he most likely took a long time to think carefully about the ages he chose and what their declining ages would indicate. Though it also strikes me that the theological themes which I’ve outlined do not stand or fall on whether the ages are ‘actual’ or not. In fact, the idea of curse vs. blessing and Adam’s line vs the serpent’s line are drawn from work by a YEC Biblical Theologian.

Could he have done it differently? Sure. Could the decay curve have been intentional? certainly! Could I be wrong? Entirely possible! :slight_smile: All I am saying is, let’s also consider that the decay curve is an interesting byproduct of the ages he chose (or recorded, depending on how you view it) rather than his express intention (from the human author at least).

Certainly, the decay curve exists, no denying that, but I believe its significance is derived from the theology the text is communicating. Or to put it in another way, the only significance the curve has in Gen 5 and beyond is that which the theology of the book invests in it.

Again these theological perspectives transcend interpretive frameworks, holding true whether one read Genesis 5 as a YEC, OEC, or EC. They also hold true whether one reads the ages leading up to Moses as actual ages, symbolic (for want of a better word) or transition from one to the other taking place after the flood.

I dunno if that makes any more sense. Cheers, Liam :+1:

We have talked about this before.

Assuming there is anything historical about these genealogies, I think a different way of measuring the ages of people is strongly indicated. This is because not only are the ages extra-ordinarily long but the time given before the birth of a son is way too long also. That part, far more than the length of life is what I find impossible to believe. Perhaps at some point in the retelling of this story, some previous way of indicating the ages of people was incorrectly translated to the new method of keeping track of this.

This is also an alternate explanation of the numerical peculiarities pointed out in the Biologos link by HRankin. That rather than indicating a numerological meaning of the numbers, it just means that the numbers were simply not translated correctly at some point.

Here’s figure 3, the key chart in that paper:

The most impressive part of the curve is its tails. The middle is a bit of a mess into which all sorts of different curves could fit, but the initial downward slope and final near-horizontal tail really do fit well. There even seems to be symmetry in that the two tails both have just a few data points rather than the cluster of points in the middle. But really, there shouldn’t be symmetry here. The few points in the downward slope are because there is one data point per generation, and the first couple numbers drop by several hundreds. The few points in the horizontal tail are because after Joshua, the only data points included are David and the average Roman lifespan. These are not the only data points in the Bible (the Roman lifespan isn’t even from the Bible), but are simply cherry-picked numbers to make an impressive curve.

Examples of cherry-picking:

  • Including multiple people in the same generation. For instance, adding Ishmael balances out Isaac (the curve is roughly between their two ages), and adding Levi – who almost touches the curve – offsets the way Joseph is significantly below the curve.

  • Including exceptions while excluding the rule. For instance, they include Joshua’s age of 110 as the sole representative of his generation, even though, as @Boscopup mentioned, the biblical text states that a couple million other people in his generation died before age 60! Suffice it to say that this data would not fit the curve.

  • Excluding biblical figures whose age is given, such as Eli, Job and the other kings after David (many of whom did not die violently).

  • Creating the tail they desired by including the average Roman lifespan as the last data point, even though it doesn’t come from the Bible and is only one of many figures that could be added.

That would only be the case if God killed Enoch at 365. While some do read the text that way, it’s more common to see something else going on that cannot be strictly equated with death (after all, the genealogy deviates from its pattern to avoid saying that he died). If it’s something else, then it doesn’t follow that Enoch was short-changed.

6 Likes

If we used Biblical figures for the Roman time period, we have the apostle John living into his 90’s. That throws off the tail of that curve quite a bit!

2 Likes

Interestingly, Enoch is one reason, along with Elijah, that I have trouble embracing the common view that the old testament saints had no belief whatsoever in a positive afterlife. If Enoch and Elijah were rewarded in someway for a particularly meritorious life, what kind of reward is it to “kill“ them earlier, even if in a painless and unique fashion?

2 Likes

If Genesis described God killing Enoch and Elijah earlier, I’d agree. That would seem to show belief in a positive afterlife. Since the text actually goes out of its way not to describe it as death, it isn’t such a compelling point for life after death.

There is no exponential decay in the numbers from Noah to Abraham. The decay curve only arises when one adds cherry-picked numbers after Abraham (as I discussed last post).

But I am with you in thinking the period from Noah to Abraham is worth a closer look. Constraining ourselves to that period avoids cherry-picking: with the exception of Noah, those ages all come out of Genesis 11, and they are all the ages given there.

Here are two charts with that data. I didn’t superimpose a curve since I don’t want to bias us towards finding an overall trend and instead want the data to speak for itself. In the first chart, the x axis shows the number of years since Noah. In the second, it shows the generation from Noah.


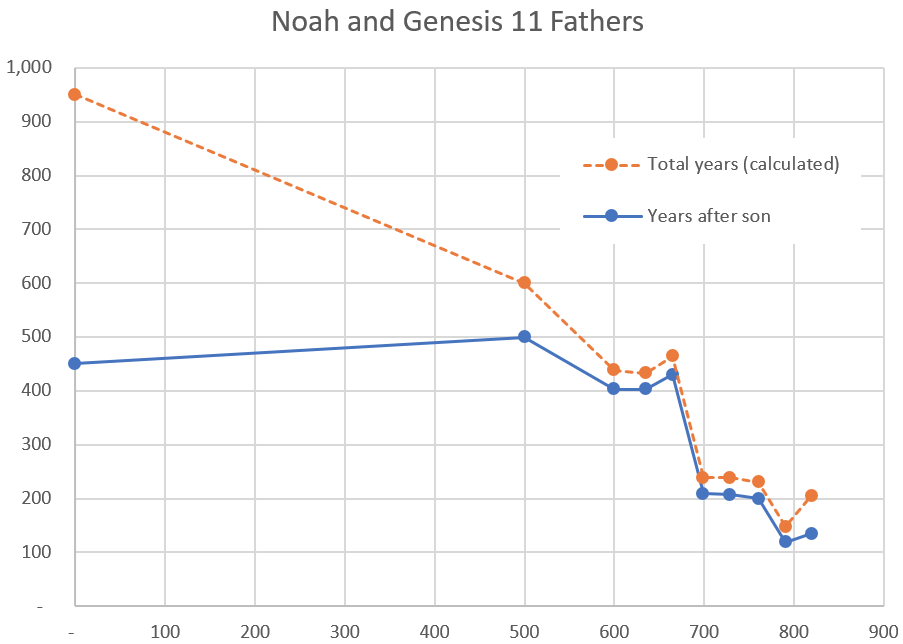
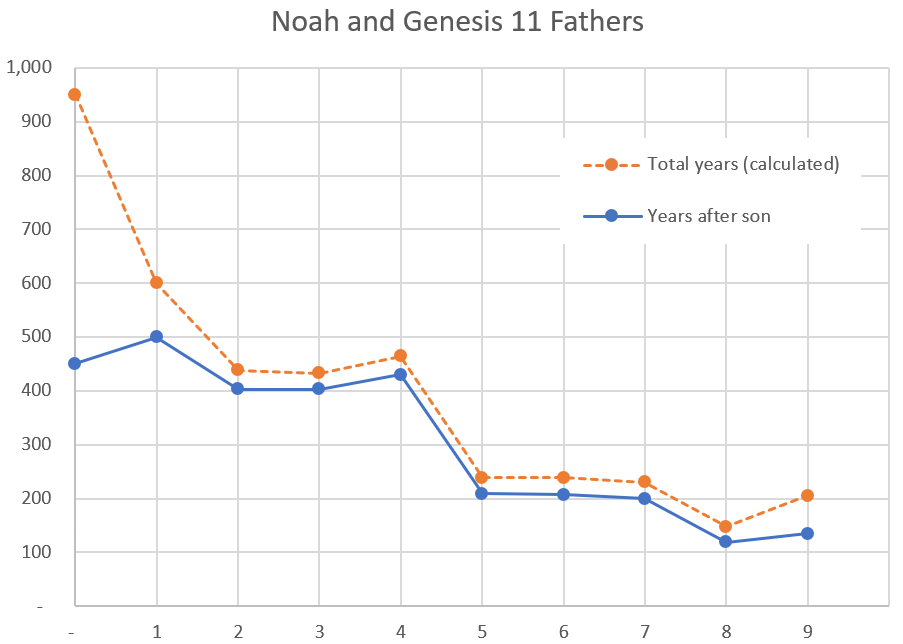
The most striking thing in the chart, to me, is the stairstep in the middle. The first five numbers fit one curve, and the second set of five numbers fit a lower curve. The text also draws attention to that point, since Peleg not only divides the genealogy in half, but Genesis 10:25 states that in his day the earth was divided. It seems that the numbers, the structure of the genealogy and the terse biographical details all highlight Peleg as the most significant individual between the endpoints.

Beyond that, another interesting feature can be seen with the blue lines. Almost all of the ages given for how long someone lived after their son’s birth are close to a multiple of 100. Noah and Terah aren’t exceptions, since their years-after-birth figures are calculated rather than stated. So when you look at the numbers given, rather than the numbers we can calculate, they stairstep from 500 to (403, 403, 430) to (209, 207, 200) to 119. The final number, 119, is very close to 120, which God said would be the days of humanity (Genesis 6:3).

So Genesis 11 seems to link the long lifespans of Genesis 5 (ending with Lamech who lives 595 – roughly 600 – after his son’s birth) to the new lifespan of 120 through using a stairstep progression that goes down by hundreds. This pattern is clearest in the ages given, not the total ages that can be calculated. The biggest descent – roughly 200 years in one generation – happens with Peleg, since the text highlights his day as bringing division.

In all, the numbers seem very intentional, and they underscore the same message told by the text. But they don’t speak of exponential decay or, in my mind, of brute historical facts.

6 Likes

I Don’t follow, or Perhaps I didn’t explain well… if the Hebrews believed that after death is… nothing, then how exactly is it a blessing to cease existing, and enter oblivion by instantaneous non-existence, rather than by dying?

“Enoch, God has a great blessing for you… you will not die, God will simply instantaneously disintegrate you instead! You’ll enter the same non-existence as every other person that dies, but you’ll do it by instantaneous disintegration rather than dying in your sleep…”

(Reminds me of the original Star Trek episode “A Taste of Armageddon”… where, when the computer decided you were selected to die, you were to report to a disintegration chamber… no pain, no fuss, no suffering, no “death”, simply instantaneous non-existence, nice and clean! You ceased to exist, but at least you could claim you never really “died”… sounds like a scam to me).

Or, put another way, if death was to the Hebrews essentially synonymous with non-existence, then what sense would it mean to say that Enoch didn’t “die”? Instantaneous Disintegration and/or immediate ceasing to exist would be just as much “death” as any other way a person would cease to exist. Everyone simply ceases to exist, Enoch’s unique and special blessing is that he simply didn’t leave a body behind?

Put simply: how, exactly, is instantaneous disintegration not simply another form of “death”?

2 Likes

Job had a thought or two about this [Job 3:13], and he probably was far from alone back in those ages when existence could be pretty hard - even terrible for so many.

So that may be more reflective of modern citizenry in affluent and comfortable nations who (in their good times anyway) find it hard to imagine how death could be considered a blessing.

All that said … your point is well-taken. My observation here doesn’t really bear much on your discussion specifically of Enoch’s unusual situation. So carry on!

2 Likes

I have to respectfully disagree. I noticed the “steps” you noted, but also observed the steps that exist are arranged in the exponential decay pattern noticed, or something close to it. In other words, you don’t start with Noah at 950, have 3 generations at 700, then 3 at 500, then 3 at 200 to end with Abraham at 175… you still have a precipitous drop from 950 to 600 to 400s…, the “step” on the left side of the chart (3 ages at 400) is still less than half of your starting point, where it would be on the exponential curve, then five more data points on a final “step”, that all trail and trend downward, but at a significantly slower rate of decay, right where they would be on said curve. Even with the smaller data set just going from Noah to Abraham, one notices this pattern.

I fear we will have to respectfully disagree here, then. If you don’t see a decay curve, I can’t make you. But even truncating the data and limiting it to Noah to Abraham, I certainly see it…

If I let that data “speak for it self”, and if I showed this plot (even without a superimposed curve) to any of my colleagues without telling them what it represented, I think they would recognize a decay curve quite easily. If I gave this to one of my colleagues and told them it was, say, operating efficiency of our reactor at different speeds, or pressure levels in a pump measured over equipment lifetime, or measured levels of contaminates in atmosphere over time while ventilating air, or the like… and asked if they saw a decay curve in this data, I can’t imagine any of them not seeing it. any of them would instantly recognize a decay curve in even this limited data.

Ok, but I don’t mind so doing to see what happens, and I got the following, simply plugging the numbers into excel and graphing it. Still follows the decay pattern extremely well, with only one outlier that itself isn’t so far outside the pattern. 7 points right on or just barely off the curve, 3 very near the curve, and just 1 outlier that is still in the general ballpark.

I am confused. In the ANE cultures, ages were vastly over estimated–30,000 years, by one estimate, I think. It’s natural to ascribe large longer ages as a method of giving respect–and probably the Hebrews believed that their ancestors did live longer.

There are studies, however, on why animals live longer–it’s a combination of genetic and environmental factors. Other than ascribing respect to the patriarchs, I see no reason why we should think that they lived longer than we do. There’s no adaptive reason, that I am aware of.

Even the Silmarillion and LOTR adapted this theme–the Elves lived forever, and the Numenoreans, “of lesser blood,” lived only a few hundred years. The Rohirrim were of average age, and their songs were “full of the sadness of mortal men.”

Exponential or other pattern in reduction of age is not a proof of genetic function or that it actually happened, is it? Maybe I’m missing the point. I apologize if so.

Thanks.

2 Likes

That reminds me of reading of how immortality on earth would be a curse. You would inevitably wind up in an accident someday hat would leave you in a vegatative state, to live forever in that state.
If you lived to 900, especially in that time with hard lives, you would doubtless be minus a few limbs, the sun would have taken it’s toll, your teeth would have worn away 800 years before and you would have to live on Paleo-Ensure. (I know some hold that they may have had super-regenerative power and such, but doubt they could grow multiple sets of permanent teeth)

4 Likes

The purpose seems to be that the writers are tracing a genealogy. When we’re doing a family tree today we would normally include dates of birth and death giving how long each person lived. It seems that the writers were doing similar but just recording age at death. Of course any genealogy would have to go to Adam via Noah.

Personally, I am not at this point trying to prove anything by the observation. I have heard various creationist interpretations. Personally, I don’t find them conclusive, but I also don’t see any better theories, either. for now I am simply trying to ignore those creationist interpretations, and explore any and all ideas, theories, hypotheses, or speculation about why this particular data is arranged in so striking a pattern.

Again, if all we had of relevance was the genesis 5 list where almost everyone was in their 900s, this would be easy to explain away as exaggeration or mistranslation or the like, as many theories would fit with that data. The exponential decay simply throws a major fly in the proverbial ointment of any other theory I have heard or examined. Whatever pattern or explanation that could apply to Genesis 5, that I have read at least, falls apart as soon as you see the recorded age is progressively shortening.

Long ages are honorific? Were the later patriarchs progressively and exponentially losing honor in the sight of their descendants?

The old ages are accounted for because they were counting months, not years? So Noah lived until 79 but his descendants progressively lived shorter and shorter until Abraham only lived until 14?

Perhaps a later redactor was trying to combine two disparate traditions, one of ancient patriarchs living into the 900s and the more recent patriarchs living into the mid to late 100s? Then who is this ingenious ancient redactor who came up with the idea of decreasing the ages of the intermediate patriarchs with these exponentially decreasing ages, and why? Because he thought this might give some credence of historicity or “science” to the ages he was inventing from scratch?

It is numerological in significance, and the numbers fit with patterns of certain anciently common multiples? Ok, but whatever multiples they were using still ended up being consistently in the 900s for a while, then quickly dropping, slowing their drop and leveling off. Even this observation, compelling and interesting as I find it, simply doesn’t help the core issue of why consistent 900+ ages, then a precipitous drop before leveling off in a slower, but noticeable, continued downward trend.

At this point I am simply trying to entertain any alternate hypotheses. And with great and sincere appreciation to everyone thus far that has contributed some ideas and thoughts, but I personally still have found none of them to adequately address my intrigue over these numbers.

1 Like

I have some relatives who trace genealogies, and it appears there is more to it than just curiosity and documenting relatives. They are linking Israel to beginnings and rooting it in creation, but are also trying to give stature and meaning to the story of Israel, to differentiate it from the other creation stories of surrounding peoples.

1 Like

I appreciate your thoughts. Long live geekiness. I Googled “gematria, patriarchs, ages” and got some interesting results on patterns and numerology, but haven’t been able to read them.

Why not a combination of reasons? Honorific for the oral history phase and translation difficulties for the early written history?

1 Like

The case of cursing Canaan, grandson of Noah, for Ham’s sin; and the general idea of curses down generations, seems to play that role, as per Enns

Translation difficulties that just happen to result in an exponential curve?

That portion of the curve is almost a straight line. And the number of samples is really getting small.

Exactly. Without Noah, it’s a straight-line slope. Even with Noah, there’s no precipitous drop if the x axis plots time (my first chart last post) instead of generations, since Noah was 500 when he had his sons.

It’s worth noting that Noah’s numbers aren’t given in the Genesis 11 genealogy that shows the post-flood decline. His total age is much higher than his father and higher than everyone in the first half of Adam’s genealogy in Genesis 5. He had the third-highest lifespan in the Bible, so of course a chart that starts with him will show a big drop.

Further, if this decay curve is supposed to arise due to environmental conditions changed by the flood, keep in mind that Noah lived 600 years before the flood (even Shem lived 100 years before the flood). I don’t know how one wants to suppose a flood affects 600- and 100-year-old people’s lifespans, but if we assume those pre-flood centuries gave them some kind of a bump in total years lived, any hint of a sharp decline at the beginning of the chart evaporates.

But maybe I’m wrong. Maybe I’m just trying to explain away the obvious. If so, I have exciting news: the New Testament also has a decay curve hidden within it. This one is even clearer. It’s found in the length of Paul’s writings to the church. This begins with Acts, of course, which includes material about Paul by his associate, Luke. Then is Romans, 1 Corinthians, etc. to Philemon. Here it is in all its glory, easily found by counting the verses in each book and plotting them in their canonical order:

Some naysayers may object to my inclusion of Acts, but Acts fits as clearly as Noah fits into a plot of post-flood lifespans. They may suggest that if I include Acts I should include Luke too, but this ignores the distinction Pentecost makes. Adding one of the gospels means we’re not plotting the same thing anymore. That would be like adding Lamech before Noah, ignoring the distinction the flood makes.

No, obviously the decay curve is real. It beggars belief to think Paul contrived this pattern through carefully shortening the length of his letters. Those who ordered our New Testament wouldn’t have had the mathematical acumen to create it. A pattern like this could not have been imposed from below, so it must come from above. :upside_down_face:

3 Likes