The other thing is that PSMC models seem to lose power once you’re past TMRCA values of over 3MYA. There are fewer coalescence events back there, so the method has a harder time. That in itself is an indication that the distribution of TMRCA values is thin out that far.
Thanks! It seems then, rereading this back into your part 2 on this topic, that the coalescent analyses presented there…since they weren’t PSMC…dealt primarily with effective population sizes as a means for indicating a lack of a severe bottleneck in relevant timescales. The telltale mark of a spike in TMRCA distributions wouldn’t have been picked up in those studies. I’m still unclear though on the relationship of effective population sizes and even very severe bottlenecks as those figures only represent harmonic means of an effective population, not minimal values. Thoughts?
1 Like
So this new data is really helpful. Got some results to show.
Also, I was able to clarify that they are using a generation time of 25 years / generation. That becomes helpful in converting to years.
Okay, some good news, they include enough to reconstruct the distribution in Figure S17. Genome-Wide Inference of Ancestral Recombination Graphs This data includes a random sample of 69 neutral regions (dashed line), compared with 69 regions undergoing balancing selection and containing no CpGs (black). The red line is the 56 regions undergoing balancing selection by with shared CpGs. Though not the entire genome, the dashed line is going to be a good estimate of the neutral genome-wide distribution.
Distribution of TMRCAs in regions predicted to be under balancing selection. Cumulative distribution functions (CDFs) are shown for the 125 regions identified by Leffler et al. [77] based on segregating haplotypes shared between humans and chimpanzees (black circles), the subset of 69 loci containing no shared polymorphisms in CpG dinucleotides (black circles) and a collection of 69 putatively neutral regions having the same length distribution. Neutral regions consisted of noncoding regions from which known genes, binding sites, and conserved elements had been removed (see [109]). Notice the pronounced shift toward larger TMRCAs in the regions predicted to be under balancing selection, and a slightly more pronounced shift for the subset not containing CpGs (which are more likely to have undergone parallel mutations on both lineages). TMRCAs are measured in generations, as in all other figures and tables.
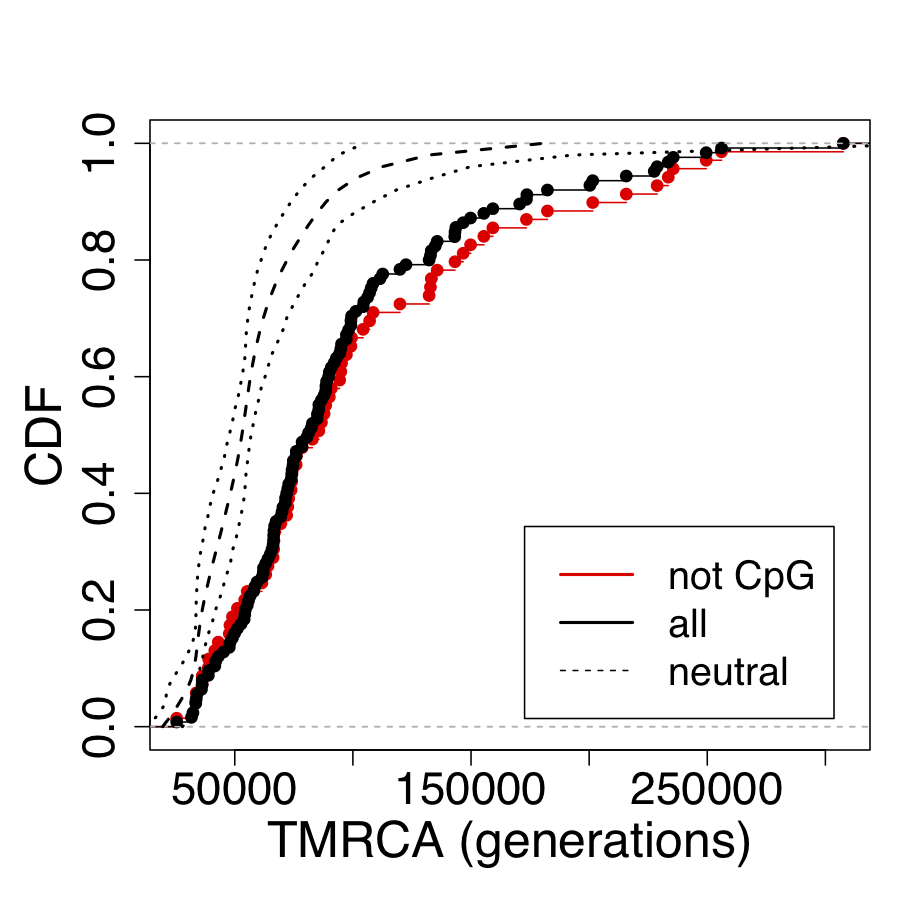
For the statistically untrained, this going to be a hard graph to read. It is a CDF, not a PDF (Cumulative distribution function - Wikipedia).
This distribution changes things quite a bit. We do not see multiple modes. We also see that there is a very high positive skew to the data, and that balancing selection (black and red lines) increases TMRCA estimates quite a bit (no surprise), as much as by 2 fold (the magnitude of that effect is a surprise to me, but in retrospect is not so surprising). This means that estimates of TMRCA that do not take balancing selection into account are going to overestimate the value substantially. The CpG sites, which have a higher mutation rates but these mutations are more likely to be shared, so these regions can decrease TMRCA by about 10%.
Several factors can conspire to increase or reduce TMRCA. Molecular clocks only work when these factors are not interfering. That is why whole genome distributions are so important. We can test the effect of different regions. For example, if we wanted, we could start to untangle how identifiably neanderthal interbreeding biases results upwards, by seeing the results on those regions separately. We can also see how positive selection (which violates the assumptions required for dating). Some regions of the genome, also have lower mutation rates (and therefore will overestimate TMRCA).
From this, we want the best estimate of TMRCA in neutral regions of the genome (the dashed line) in a way that reduces these sources of error. This is a fairly important point as dates, can can only be reliably inferred in places that are not under selection. These are the only places where a molecular clock is expected to hold. Even then, some regions will still get “lucky” and coalesce more quickly to or much more slowly. So to a first approximation, we want the the median of these values. The median has another helpful feature. It should exclude the effect of regions we know for a fact include evidence of interbreeding with neanderthals and denisovans in the last 100 kya or so. Unfortunately, it cannot exclude regions affected by more ancient interbreeding (which could be the entire genome).
Nonetheless, we can make our estimate. In the regions not under selection, we see a mode for the TMRCA at about 50,000 generations. You can see it yourself tracing the blue line in the graph:
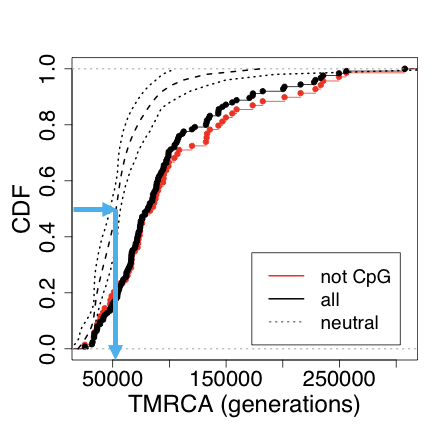
Multiplying by 25 years / generation, and dividing by four, this gives us a TMR4A of about 300 kya. By the way, I’ve grown more convinced in the TMR4A estimate, based on a brush up on the mathematics of phylogenies and coalescents.
This is a TMR4A about 2 times greater than y-MRCA and m-MRCA (which are about 150 kya to 200 kya); how do we make sense of this? Remember, Y and mito DNA does not recombine. So it is essentially a lot of data about single “block” of the genome. To some extent, is a single sample from this distribution. When we look at a whole genome, however, we are looking at about 100,000 “blocks”. We have less information per block, but there are just so many more of them. With that in mind, the y-MRCA and m-MRCA are entirely consistent with this distribution, but the mode of this distribution is a better estimate.
I should add that TMR4A in autosomal regions outside this range are suspicious. We need an explanation of why we should trust values inconsistent with the y-MRCA and m-MRCA. I’ve given one here for this data, but based on this data I’d be skeptical of data that put TMR4A outside this range.
So this does plausibly make the case stronger, pushing the TMR4A back from 150K to 200K (from y-MRCA to m-MRCA) to a non-cherry picked number of about 300 kya (probably plus or minus 20 kya). This number is corrected for bias due to positive selection and recent interbreeding, and is consistent with the y-MRCA and m-MRCA data.
That does support Dennis’s claim if Homo sapiens arise 200 kya ago and there was no interbreeding. However, there was interbreeding, and we found out this year that Homo sapiens might have arisen earlier than 300 kya. To be clear, the correspondence between 300 kya between the mode TMR4A and the origin of Homo sapiens can not be interpreted as evidence for a bottleneck at this specific point in time. Rather, this view of the data data does not specifically dispute the bottleneck hypothesis. To the point, I think we have much more confidence in heliocentrism than this data’s ability to demonstrate Dennis’s claim.
Though this has been immensely interesting and informative.
There is, of course, other data. I still point to trans-species variation. Speaking of which…
The only way there can be trans-species variation between us and chimps is for there to be balancing selection (or perhaps inconceivably recent interbreeding). Coalescence times for neutral regions are more than one order of magnitude smaller than divergence (as we have just seen). We just do not expect any trans species variation in neutral regions of the genome. Evidence of trans-species variation are very strong evidence that TMRCA’s in this region are not valid.
Regions under balancing selection need to be handled with seperate reasoning. For example, the TMRCA / 4 = TMR4A estimate certainly does not apply here. TMR4A can be arbitrarily smaller than TMRCA if the trans species variation is 4 or less alleles (coalesced). The paper being referenced here appears to show only five regions with only 1 to 3 ancestral alleles in each region. That would push the TMRCA back, but not the TMR4A.
To be sure, this is evidence for common descent, but unless we see more than four alleles in a single locus (in an autosomal region), as it appears we do in MHC antigens (the Ayala), it does not make the case against a bottleneck. The alternative explanation for Ayala’s MHC data is convergent evolution (which is where I’m sure @RichardBuggs will go). I’m much less convinced by this; and it is also testable by comparing with orangutan and gorilla data (though admittedly not yet tested).
I don’t have time to go through all of you analysis at the moment - but thanks, I will look at it later - but I do agree with you on this point. I’m certain @RichardBuggs will appeal to convergent evolution for this as well. I guess he would have to appeal to the same for any trans-species polymorphism.
I haven’t had time to look at this in detail, but in the Science paper they discuss neutral hitchhiking along with the selected SNPs (i.e. neutral loci in LD with selected ones).
Another quick comment, because I might be missing something here. From that CDF graph, it looks like about 50% of the dataset is above TMRCA = 50,000 generations. Am I reading that correctly? 50% is above, 50% is below?
Edit: I mean for the neutral stuff.
1 Like
That’s correct. I accidentally called that the mode. I should have said median.
1 Like
No worries. Thanks for pointing out that graph.
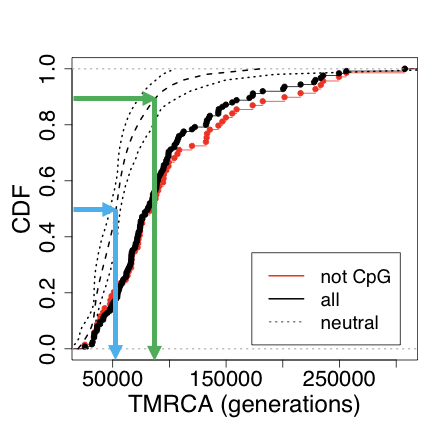
I’m eyeballing it, but it looks like the 0.5 to about 0.9 sits between 50,000 and 100,000 generations. If I’m reading this correctly, that would mean a substantial portion of the neutral dataset would have a TMR4A above 300KYA (the range would be 300 - 600 KYA). Am I missing anything here?
I think it’s clear who Dr Bugg’s actual audience is; people who don’t accept evolution, who don’t accept common descent, and who believe in a historical Adam and Eve who were a specially created pair of homo sapiens from whom all homo sapiens who ever lived, have descended.
First the article “Geneticist: Adam and Eve could have existed”. The title alone is pretty clear. The follow up articles are even clearer. The article “Adam, Eve, Richard Buggs, and Dennis Venema: Could Adam and Eve have existed?” makes it abundantly clear what the aim of the exercise is; to establish the historicity of Adam and Eve as a special creation who were the sole ancestors of every homo sapiens who has ever lived, in accordance with standard conservative Christian theology (and YECs).
The article gets right to the point, explaining exactly what the issue is really about.
Dennis Venema replies to Buggs, insisting that Adam and Eve could not likely exist. Geneticist Richard Buggs thinks that they could have.
It’s worth noting of course that Dr Buggs has actually said nothing about Adam and Eve, and has in fact avoided mentioning them entirely. But that won’t stop the author of this article.
In case we didn’t get the point, it’s repeated at the end of the article.
Geneticist defends possible Adam and Eve in Nature: Ecology and Evolution
and
Geneticist: Adam and Eve could have existed
The comments are another excellent indicator of Dr Bugg’s audience.
J-Mac November 10, 2017 at 4:38 pm
I am a Christian and I disagree with the claim that mankind descended from a single breeding pair.
Then you not a Christian…You are a pseudo-christian like all theistic-evolutionists resembling Ken Miller, Dennis Venema and the rest of the so-called christians who sold Christianity for the sake of being called a scientist…
Dean_from_Ohio November 10, 2017 at 5:33 pm
Four Faces @ 1,
I am a Christian and I disagree with the claim that mankind descended from a single breeding pair.
Be careful; Christian theology, and the forgiveness of your sin, require an actual Adam. Romans chapter 5 irrefutably makes this claim. Believe it or not.
I agree, but I would say this places the median TMR4A at ~300 KYA. The distribution has a substantial amount of the neutral data above this value. If we’re interested in the maximum range of TMR4A that we can have confidence in, it would seem to me that we could look at the error lines on the CFP. The upper error line for the neutral set hits 1.0 right around 100,000 generations. So, worst case scenario, about 50% of the neutral TMRCA distribution sits between 50,000 and 100,000 generations. This would mean that about 50% of the neutral dataset has a TMR4A between ~300 KYA and 625 KYA. That seems pretty relevant to the question at hand. Thoughts?
Dennis…trying to follow along here, what is the significance of what you and Josh are discussing relating to the TMRCA distributions?
Isn’t that our audience too? We also already know that belief, as you stated, is consistent with the evidence any ways. So I am not sure what it has to do with this conversation.
The other quotes are interesting on theology, and would be great to discuss on another thread. Especially if you can provide references (i.e. links). If that is what @RichardBuggs has ever written, he is wrong. Those are by random commenters on the internet though. Seriously. Even the recent critique of Theistic Evolution goes out of its way to clarify that they see theistic evolutionists as brothers and sisters. Fully Christian, even if they are wrong.
I’d love to see that conversation continue. Elsewhere. It is not relevant to the scientific question at hand.
Lest anyone doubt it, Scripture is 100% clear that doctrine of Adam is not how we determine who is a true and pseudo-Christian. @DennisVenema affirms the BioLogos belief statement, and that puts him solidly within the Christian community.
That is about right, if you follow the green line you can see this. However, this does not really give us any additional information that helps your case. We can’t use these to legitimately skew our estimate upwards.
This is not sound statistical reasoning.
Keep in mind that these are not TMRCAs but TMRCA estimates. There is very high variance to all these estimates that increases as the true TMRCA increases. We expect a spread much like this if there was a bottleneck. If the goal is to rule out a bottleneck hypothesis, data we do not expect under the hypothesis is needed instead. That is not what this is.
Remember, the Zhao 2000 paper (which I am now glad we covered in depth) gave a very large range.
Notably, the region size here is 10,000 bp, matching the block size in this study. That means the confidence interval estimate here is going to somewhat match the confidence intervals we expect for individual blocks near the median in this study. However, for blocks giving larger TMRCAs the variance will be even higher. Really, we have no confidence that any individual blocks did in fact actually colesce after the median estimate of 4*300 kya.
Remember, in a bottleneck hypothesis, all their errors would be correlated. We cannot just aggregate them after selection like that to reduce their confidence intervals. That is the definition of cherry picking.
There is another problem too. Mutation rates.
You can probably clarify from a deeper reading, but it appears that this study assumes a constant mutation rate across the whole genome. We know from both genome wide comparison and direct measurement now, that de novo mutation rates vary by 2 to 3 fold across the genome. Using the average mutation rate instead of the region specific rate, essentially, will double the TMRCA estimated at fast mutating sites (e.g. high CpG regions that are recombination hotspots). The effect this would have, if in fact a constant mutation rate was used, is that the spread of this distribution would increase, with biggest effect on the high TMRCAs.
This means, therefore, that we cannot really get a high confidence ancient TMRCA from your observation. It just isn’t there. All that this graph tells us is that there is opportunity for cherry picking data. At both ends of the spectrum. I suppose I oppose cherry picking on both ends. I’m sure you do to.
The significance of this is high.
It strongly undercuts the claim that genome wide TMRCAs provide strong evidence against a bottleneck in Homo sapiens since they arose. Moreover, we have not even corrected yet for ancient interbreeding.
Perhaps there is strong evidence against a Homo sapien bottleneck, but I have yet to see it. As far as a I know, there is no way to correct for ancient interbreeding. Without that correction, I’m not sure how we get to heliocentrism level certainty. Though maybe Dennis can show us.
Regarding an ancestral bottleneck (not a Homo sapien bottleneck), as I’ve repeated the strongest evidence is trans species variation, as far as I know.
Would the definition of a bottleneck be that all subsequent population is descended from a limited number of individuals? So if there’s later interbreeding with a neighboring population (Neanderthals et al) then does it really count as a bottleneck in the first place?
And theologically speaking, just to clarify, would an argument that there was a bottleneck to two in very ancient homo sapiens, only it’s genetically undetectable due to later interbreeding with Neanderthals etc, rely heavily on reinterpretation of the sons of God/daughters of men in Genesis 6:2 to be referring to this interbreeding?
At what time? I’m not following you here.
I don’t know about you, but I don’t think my audience is people who want to be convinced that there’s good genetic evidence that they can retain credible belief in a literal, specially created Adam and Eve (who had no ancestors), less than 10,000 years ago as the ancestors of all homo sapiens, while rejecting evolution. I don’t think that argument can be made.
Consistent with what evidence?
I linked to the page with the comments, and said I was quoting comments from that page.
Putting this on pause till new years. Post saved. Will return it later =).
2 Likes
Okay, you BioLogos junkies…I’m insisting that you take that break you have all been promising your loved ones and get off this thread for at least the next two days. Because none of the moderators want to read esoteric calculations over the next couple days. Have a lovely Christmas everyone, I’ll open the thread on the 26th.
7 Likes
I went back to look, and I don’t think the way he phrased his heliocentrism quote in the book allows for a bottleneck of two followed by interbreeding. Here it is:
So the implication is clearly of “we descend from only two people,” not of interbreeding, although the last bit does give you perhaps a bit more wiggle room as far as how far back to stretch it: not just Homo Sapiens but whatever intermediate directly preceded it, i.e. the 300kya Homo Sapiens with evolutionary differences would clearly be included by this statement. Which Dennis has already agreed to include, so that’s all right.
It’s probable he’s phrased it other ways in the course of this conversation, but this was the published statement.
2 Likes